
LMS REPORTING, ANALYTICS & INSIGHTS
Your complete LMS dashboard
Turn your data into actionable next steps. See how your e-learning business performs across every funnel stage. Dive deeper into user progress, engagement, and cash flow visibility with LMS reporting.

Elearning business report templates
Course engagement matrix dashboard
Scheduled performance reports
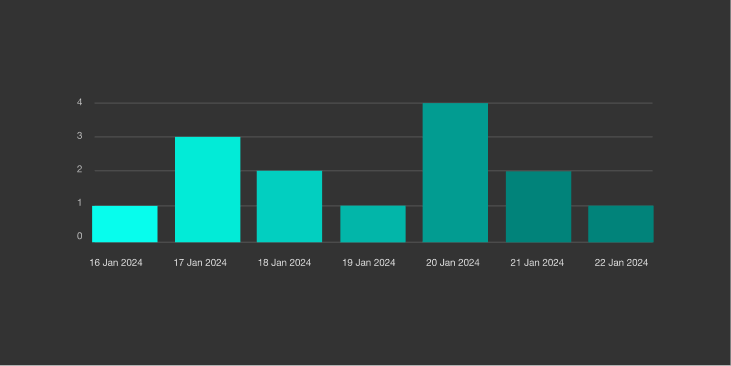
24+ charts to monitor engagement and progress
Radar charts for your top-performing courses
Learning performance data visualizations
TL;DR
LearnWorlds provides comprehensive LMS reporting and analytics tools that help you:

Generate automated scheduled reports and export data exactly when you need it to simplify admin tasks.
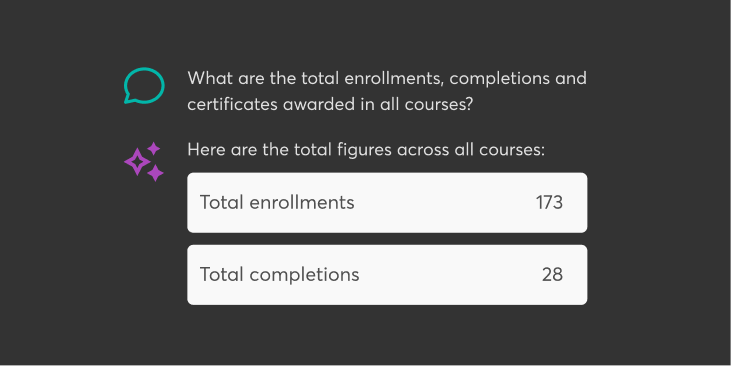
Use AI-powered insights to answer questions about your business and user performance for data-driven decisions.
Easily visualize complex learning data with radar charts, dashboards, and reports using ready-made templates.
Best for:
Training providers, online course creators, L&D corporate training teams, educational institutions, and online coaches or creators seeking data-driven insights into learner behavior and course effectiveness.
Measure and report the impact of your training programs with a dashboard for LMS
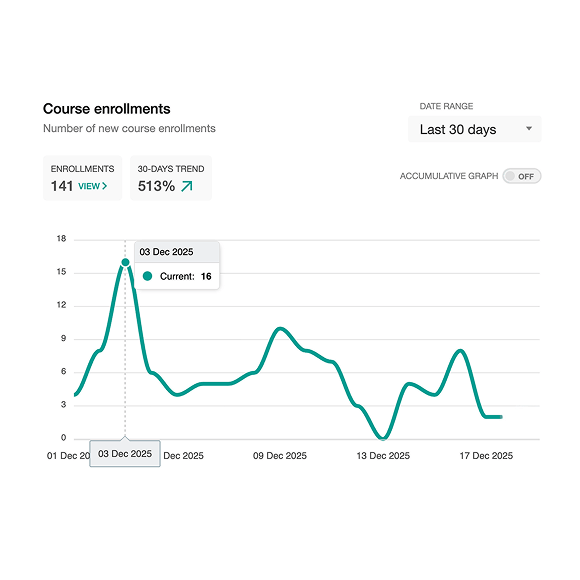
Measure user progress
Track user progression, exam results, survey responses, and course participation history at the click of a button in your LMS dashboard.
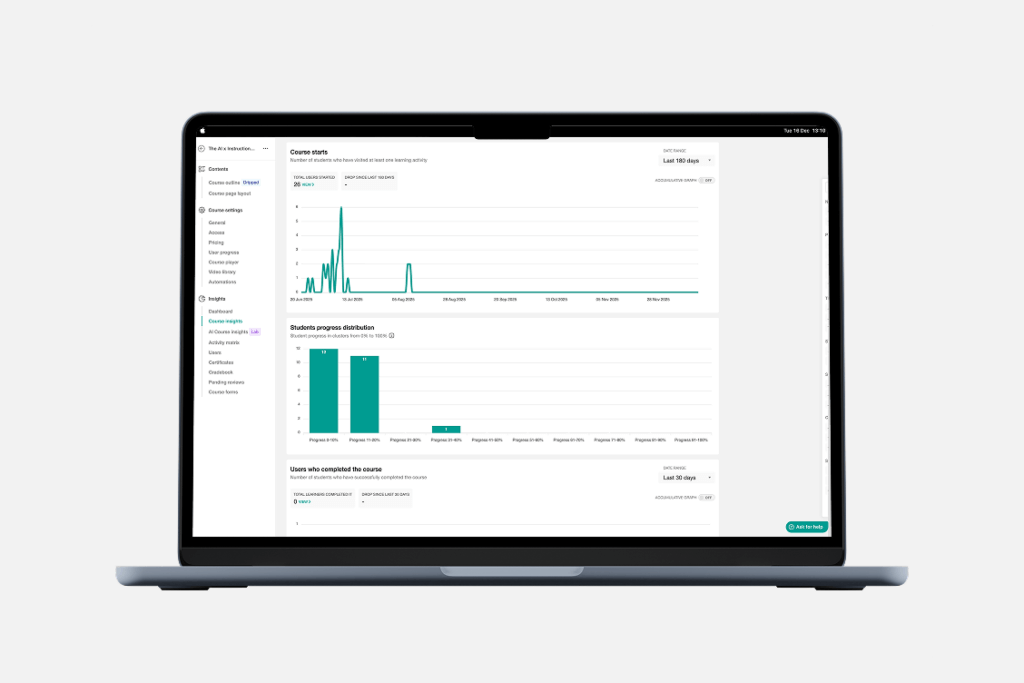
Deep dive into course insights
Quickly understand from your LMS Dashboard how learners navigate your courses, identify friction points, and turn valuable insights into improvements that enhance both your learning experience and your business results.
Prepare automated reports
Automate report distribution and keep your most important stakeholders up to date with reports automatically extracted and emailed with our LMS reporting tools.
How Konsultori used LearnWorlds reports to scale customer education
With LearnWorlds analytics, Konsultori Academy turned a boutique consulting business into a scalable academy:

“LearnWorlds allowed us to grow while keeping our uniqueness.”

Stefan Filipovic,
Product Manager & Automation Specialist, Konsultori Academy
Reached learners in 10 countries
Saved 30-40 hours every month through automation and centralized reporting
Achieved a 100% course completion rate in their blended programs
Increased course-related revenue by 78%
How Blip used LearnWorlds reports to scale customer education
After launching Blip Academy with LearnWorlds and using analytics to optimize their training:

“If in a week, our team could onboard five companies, now they can onboard ten companies in one training session, in one day.”

Lara Oliviera,
Learning Specialist @ Blip
Onboarding time dropped from 73 days to 43 days
Customers are onboarded 41% faster
Incoming support tickets decreased by 15%
Course completion rates increased 10x
How Workable improved its onboarding process with data
Workable used LearnWorlds analytics to replace weekly onboarding webinars with on-demand training backed by real-time reporting:

“LearnWorlds is an intuitive platform that allows you to create professional and tailored learning experiences, backed by a great team.”

Workable,
Customer Enablement Team
Built 19 professional courses in just over a years
Trained 2K+ learners through Workable Academy
Reached 350 monthly active users early on
Saw 10%+ user growth per month in their academy
Grow your impact with out-of-the-box LMS reporting tools
Filter and export learner segments with 95+ different filters
Apply simple or highly elaborate filters for users, courses, social interactions, and UTMs to your LMS reports before you export them and get all the information you need.
Enable your team to create data-backed content
Get learning insights for you and your team, check course completion rates, see which sessions get more replays, review progress data, exam scores, and time spent in learning. Connect these insights with performance to support course development.
Leverage powerful data visualization for your partners
Give partners, customers, instructors, and managers visually engaging metrics with LMS analytics.
Take the pulse of your school with the right LMS reports
Learn how your learners interact with your courses and get answers to key questions with LMS reporting.

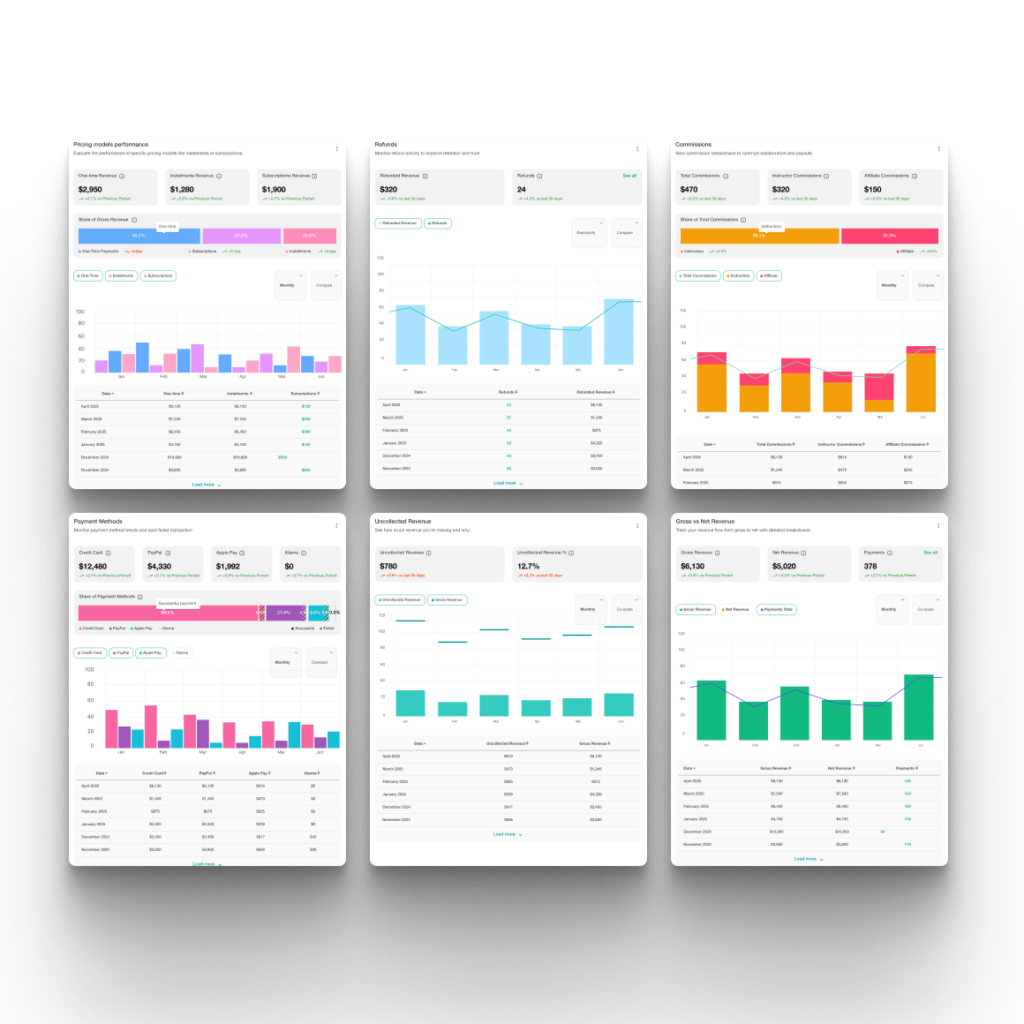
See what drives revenue
Track gross and net revenue, refunds, commissions, payment methods, pricing models, and location from Sales Analytics. Filter results by date, pricing model, payment method, and country to understand where revenue comes from and how performance changes over time.
Improve your courses with the most in-depth insights and LMS analytics
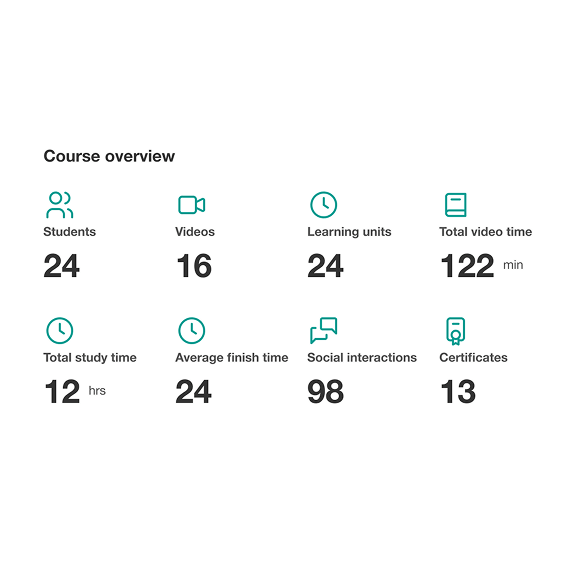
Dedicated course dashboard
Offer trainers a dedicated course dashboard that surfaces their most important insights. View enrollment steps, exam scores, user behavior, and pacing toward activity completion to guide training with confidence.
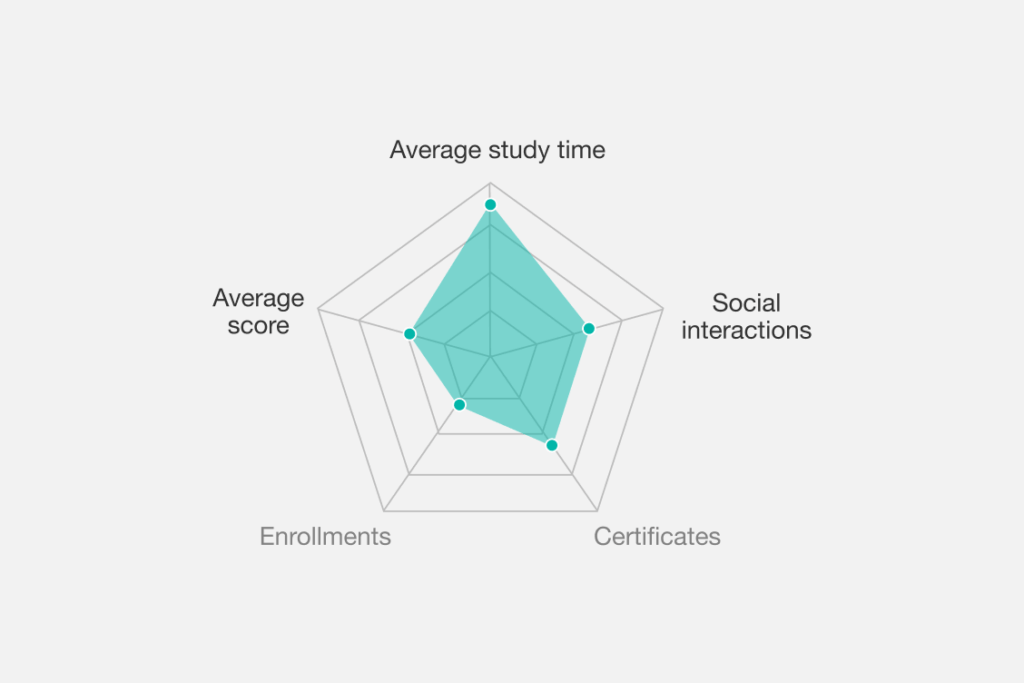
Radar charts for your top-performing courses
Identify your most effective courses with radar charts that map engagement, completion rates, and time spent. Get to know what brings you real results.
21+ charts to monitor engagement and progress
Track learner activity, quiz performance, and engagement trends with charts including completion rate graphs, time-on-task visualizations, assessment score distributions, video engagement heatmaps, and learning path progressions. These charts help identify struggling learners, optimize content pacing, and demonstrate training ROI to stakeholders.

95+ filters for course users
Segment users by enrollment date, completion status, geographic location, user role (student, instructor, admin), activity level (active, inactive, at-risk), course category, payment status, certification progress, and engagement score. Use these filters to identify compliance gaps, reward high performers, send targeted communications, or create custom cohort reports for different departments. Get detailed visual analytics on every course activity, from video views to assessment scores. Refine your content based on what learners engage with most.
Shorter time to insight with AI in learning analytics
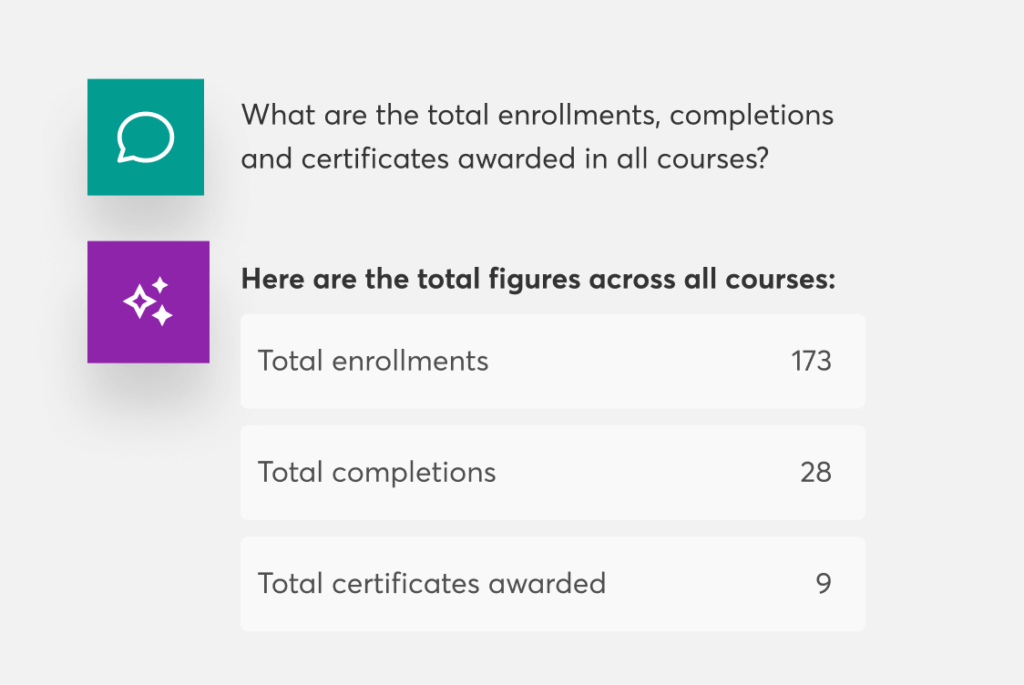
AI Insights Hub in LearnWorlds is like having your data analyst ready to answer questions about your academy’s performance at any time.
Instant insights at your fingertips
Ask AI whatever you want to know about your academy performance, and get instant, clear answers or graphs.
See the bigger picture, faster
AI pulls together data from your Reports Center, Course insights, and Sales reports to give you the insights you seek.
Chat with AI, get context-aware analysis
AI in learning analytics remembers the context of your conversation, so you can ask follow-up questions without starting over.
Data-driven insights you won’t find anywhere else
LearnWorlds brings together all your elearning data from every corner of your platform. By merging these insights, it delivers detailed, trustworthy answers that external analytics tools simply can’t match.

“The student data that Learnworlds provides is second to none. Having the front-end website builder with all of the backend functionality and data is fantastic”

Explore more features of LearnWorlds’ learning analytics platform
Experience the power of LearnWorlds’ full suite of features. The most advanced on the market to build, market, and analyze your school through LMS reporting.
Flexible Courses
Design impactful learning journeys that motivate and inspire.
Interactive Video
Use video-based learning to boost engagement and retention.
Pop-up Builder
Use popups strategically to guide users and highlight key actions.
Affiliate Programs
Grow through referrals—set up and manage your affiliate network.
AI Assistant
Bring your knowledge to life: AI supports you with tailored insights and content suggestions.
Mobile App Builder
Create a branded mobile experience that fits your learners’ lifestyles.
Bundles & Subscriptions
Increase revenue with flexible bundling and recurring payment models.
Survey Builder
Collect feedback that helps you refine your courses and strategy.
Website Builder
Launch a polished elearning site effortlessly—no technical skills needed.
Checkout & Payment
Offer smooth, secure transactions with full control over pricing.
Assessment Builder
Create reliable, user-friendly quizzes and self-assessments with ease.
Analytics & Reports
Monitor performance across your school with built-in LMS reporting and analytics.
Marketing Tools
Promote your academy with powerful tools built for conversions.
Live Sessions
Connect in real time to strengthen learner engagement and community.
Custom User Roles
Assign permissions confidently with tailored access controls.
Integrations
Extend your school’s reach with seamless connections to your favorite tools.
SCORM
Upload and manage SCORM/HTML5 content for interactive course delivery.
White-label Website
Deliver a completely branded experience—your school, your way.
LTI
Bring external learning tools into one consistent training experience.
Course hub
License quality courses from other academies.
LearnWorlds Analytics features comparison
| Feature | Basic LMS | LearnWorlds |
|---|---|---|
| Pre-built reports | Limited | 24+ chart types |
| User filters | 10-20 | 95+ filters |
| AI-powered insights | No | (AI Insights Hub) |
| Automated reporting | Manual | Scheduled delivery |
| Real-time data | Delayed | Live updates |
How can different industries use LearnWorlds’ LMS dashboards?
Every industry has unique training challenges and reporting needs. LearnWorlds’ flexible analytics platform adapts to sector-specific requirements, helping organizations track what matters most to their learners and stakeholders.


Corporate
Visualize employee training and onboarding, leadership development, and cross-department training metrics.


Education
Measure student engagement, course completion, and participation in live sessions.

Creators
Use learner analytics to refine content, grow engagement, and engage students in course completion across self-paced learning or community-led programs.


Non profit (NGO)
Track volunteer training, project-specific learning goals, and certification across teams.
Industry-specific LMS analytics & reporting made easy
No matter your industry, LearnWorlds provides the LMS reporting tools and analytics dashboards you need to track what matters most. With 95+ filters, 24+ chart types, and AI-powered insights, you can customize your analytics experience to match your specific training goals, compliance requirements, and business objectives.
Ready to see how LearnWorlds analytics work for your industry?

Industries
Financial institutions face strict regulatory requirements and compliance deadlines. LearnWorlds dashboards help compliance officers and training managers track mandatory training completion across distributed teams and generate reports for regulators.
Key metrics tracked:
- Compliance training completion rates
- Time-to-certification for new regulations (eg AML, KYC training)
- Audit trail documentation with timestamped completion records
- Knowledge assessment scores to verify comprehension
Common use case: A multinational bank uses LearnWorlds to track anti-money laundering training across 12,000 employees in 40 countries. Automated reports show regional compliance rates, flag at-risk employees who haven’t completed training, and export audit documentation for regulatory reviews—saving 80+ hours monthly in manual reporting.
Healthcare providers must ensure clinical staff maintain current certifications while tracking patient care training effectiveness. LearnWorlds analytics help medical training coordinators monitor mandatory education, measure patient safety training impact, and demonstrate continuing education compliance.
Key metrics tracked:
- Mandatory training completion for clinical protocols
- Patient care module engagement and assessment scores
Common use case: A hospital network with 3,500 nurses uses LearnWorlds to track infection control training updates. The dashboard shows which units have completed new protocols, identifies nurses approaching recertification deadlines, and generates reports for Joint Commission accreditation reviews. Radar charts reveal which training modules correlate with improved patient safety scores.
Corporate L&D teams use LearnWorlds to transform employee training from a checkbox exercise into strategic workforce development. Analytics reveal skills gaps, track leadership pipeline progress, and demonstrate training’s direct impact on business performance.
Key metrics tracked:
- New hire onboarding completion timelines
- Skills development progress across competency frameworks
- Leadership program engagement and promotion readiness scores
- Training ROI calculations linking learning to performance reviews
Common use case: A tech company with 2,000 employees uses LearnWorlds to manage leadership development programs. The analytics dashboard segments participants by department, tracks course completion against promotion timelines, and correlates training engagement with employee retention rates. Managers receive automated monthly reports showing their team’s learning progress, while executives access radar charts comparing departmental investment in professional development.
Schools, universities, and educational organizations use LearnWorlds to monitor student success, identify at-risk learners early, and optimize curriculum effectiveness. Educators gain visibility into how students engage with course materials beyond traditional grade books.
Key metrics tracked:
- Student engagement levels
- Course completion rates and drop-off point identification
- Assignment submission patterns
- Live session attendance and participation metrics
Common use case: A university offering hybrid courses to 5,000 students uses LearnWorlds analytics to identify struggling learners before they fail. Instructors receive weekly dashboards showing which students haven’t logged in recently, who are falling behind on assignments, and where entire cohorts struggle with specific course modules. This early-warning system increased course completion rates by 23% and helped advisors provide targeted intervention.
Fitness instructors, yoga teachers, and wellness coaches use LearnWorlds to track client progress through certification programs, membership engagement, and content consumption patterns. Analytics help identify the most effective training formats and optimize client retention.
Key metrics tracked:
- Certification program completion rates and timeframes
- Workout video engagement and completion percentages
- Instructor-led session attendance and participation
- Client progresses through progressive training programs
Common use case: A yoga certification school with 800 active students uses LearnWorlds to track trainees through 200-hour teacher training programs. The dashboard shows which modules students complete fastest, where they replay content most, and how long they spend on practice assignments. Instructors use this data to adjust pacing, add supplementary materials to challenging sections, and identify students who need additional support—improving first-time certification pass rates by 34%.
Business coaches, life coaches, and consultants use LearnWorlds analytics to measure client transformation, demonstrate program effectiveness, and refine their methodology based on data. Reports help coaches prove ROI to corporate clients and individuals investing in professional development.
Key metrics tracked:
- Client progresses through multi-phase coaching programs
- Assessment score improvements
- Session recording views
- Follow-up questionnaire responses measuring behavior change
- Group coaching participation and peer interaction metrics
Common use case: A business coaching firm serving 200 entrepreneurs uses LearnWorlds to track clients through a 12-week growth program. The dashboard reveals which modules generate the most engagement, how quickly clients complete action items, and which exercises correlate with the best business outcomes. The firm exports these analytics into case studies demonstrating that clients who complete at least 80% of the course materials see average revenue growth of 40% within six months.
SaaS companies, enterprise software providers, and product-focused businesses use LearnWorlds to track customer onboarding, reduce support tickets through education, and measure product adoption. Analytics connect training completion to customer success metrics.
Key metrics tracked:
- New customer onboarding completion rates
- Certification program participation among power users
- Training engagement metrics
Common use case: A B2B SaaS company with 1,200 enterprise clients uses LearnWorlds to educate customers on advanced platform features. Analytics show that customers who complete the advanced training series open 60% fewer support tickets and renew at a 25% higher rate. Customer success managers use dashboards filtered by account to identify clients who haven’t engaged with training resources, triggering proactive outreach that prevents churn.
Nonprofits and NGOs use LearnWorlds to track volunteer training, measure program impact across geographic regions, and demonstrate effectiveness to donors and grantmakers. Analytics help resource-constrained organizations maximize their training investments.
Key metrics tracked:
- Volunteer onboarding completion before field deployment
- Project-specific training progress
- Training effectiveness is measured against program outcomes
- Report metrics showing training reach and impact
Common use case: An international development NGO with 3,000 volunteers across 25 countries uses LearnWorlds to deliver standardized training in local languages. The dashboard tracks completion rates by region, identifies areas needing additional support, and generates visual reports for donor presentations. By correlating training completion with field performance metrics, the organization demonstrated to funders that villages with fully-trained volunteers saw 40% better program outcomes—securing continued grant funding.
Independent course creators, subject matter experts, and online educators use LearnWorlds analytics to understand their audience, optimize course content, and grow revenue. Data-driven insights help creators make informed decisions about content updates, pricing, and marketing.
Key metrics tracked:
- Course completion rates
- Engagement patterns on content
- Community interaction metrics in discussion forums
Common use case: A creator with 5,000 students across four online courses uses LearnWorlds analytics to optimize content continuously. Radar charts show which courses have the highest engagement and completion rates. By analyzing where students drop off, the creator identifies confusing modules, adds supplementary materials, and restructures pacing. After implementing data-driven improvements, average course completion increased from 32% to 58%, leading to more testimonials, higher satisfaction scores, and increased word-of-mouth referrals.
Support articles
Log in to your LearnWorlds academy dashboard. Then:
- Navigate to the Reports Center from the main menu
- Select the type of report you need (user progress, course insights, or sales)
- Apply filters to segment your data (by course, user role, date range, etc.)
- Generate your report (in tabular format eg CSV or XLS)
- Export or schedule the report for automatic delivery
Understand user behavior, optimize learning experiences, and improve conversions by integrating analytics tools like GA4, GTM, Mixpanel, Hotjar, Facebook Pixel, Mouseflow, FullStory, and FullSession.
Support article: Use analytics tools
Easily activate Mouseflow using your Website ID to track user behavior with session replays, heatmaps, funnels, and feedback tools.
Support article: Integrate Mouseflow with LearnWorlds
Enable Mixpanel with your project token to automatically track sign-ups, purchases, and page views, with options for advanced server-side event tracking.
Support article: Integrate Mixpanel with LearnWorlds
Explore all available analytics and monitoring tools—including GA4, GTM, Mixpanel, Facebook Pixel, Hotjar, FullStory, Mouseflow, and FullSession—accessible under Settings → Integrations → Analytics.
Support article: All LearnWorlds Analytics Integrations
Access powerful reporting tools with 95+ filters, segmentation options, exports, and scheduled report delivery for deep insights into learner progress and performance.
Support article: Use LearnWorlds Reports Center
Track, filter, and monitor all scheduled, in-progress, and completed reports directly from the Reports Log for full reporting oversight.
Support article: Reports log page
Schedule automated daily, weekly, or monthly reports in CSV or XLS format, manage limits based on your plan, and deliver them to selected recipients.
Support article: Schedule report
Use your Dashboard to monitor users, sales, course progress, and engagement trends, and quickly access shortcuts like assignments, posts, and activity logs.
Support article: All dashboards & reports
Use AI Insights as an instant data analyst to answer performance questions, generate charts, and provide actionable intelligence across learners, courses, revenue, and engagement.
Support article: AI-enhanced reporting with LearnWorlds
Glossary of terms
LMS (learning management system): A platform used to deliver, manage, and track educational courses and training programs.
LMS dashboard: A visual interface within an LMS showing key metrics like learner progress, engagement, and performance.
LMS analytics: Data insights extracted from user behavior within the LMS, including course completion rates, assessment scores, and learning engagement patterns.
LMS reports: Automated or on-demand data exports summarizing learner activities, compliance tracking, and exam results.
Learning analytics platform: A comprehensive system for analyzing learner behavior, progress, and performance to improve training effectiveness.
LMS analytics dashboard: A specific dashboard for tracking learning analytics within an LMS, including filters and charts to support data-driven decisions.
AI in learning analytics: The use of artificial intelligence to interpret learning data, provide performance recommendations, and automate insights.
Report templates: Pre-configured layouts for generating LMS reports efficiently.
Compliance tracking: Monitoring whether users have completed mandatory training aligned with industry or regulatory requirements.
SCORM (sharable content object reference model): A standard for packaging and delivering elearning content.
Radar charts: Visual data representations that map engagement, completion rates, and other performance indicators for top-performing courses.
LMS filters: Advanced segmentation tools in LearnWorlds that allow admins to analyze data based on roles, user activity, geography, and course categories.
Automated reporting: Scheduled report generation and distribution via email, allowing teams to stay updated without manual work.
Course insights: Detailed analytics on how learners interact with specific courses, including drop-off points, quiz performance, and engagement trends.
User segmentation: Dividing learners into cohorts based on filters like department, region, role, or performance level to tailor learning paths and reports.
Custom dashboards: Tailored visual analytics displays for different stakeholders (e.g., trainers, executives) to highlight relevant KPIs.
Cohort analysis: Comparing groups of learners over time to identify trends in engagement, completion, and retention.
Heatmaps (video engagement heatmaps): Visual indicators of how users interact with video content—showing which parts are replayed, skipped, or abandoned.
Mobile learning analytics: Tracking learning behavior across mobile devices.
API reporting access: Programmatic access to LMS data via API for custom dashboards or integrations.
FAQs
LMS reports are data summaries that show how learners interact with your courses. They include metrics like:
- Course completion rates
- Time spent on content
- Assessment performance
These metrics help you track progress, identify learner trends, and improve the overall student experience. For example, monitoring time spent on key modules can help you identify where learners lose interest—insights you can use to redesign content and engage learners in course completion more effectively.
By using all essential LMS reports, you can uncover patterns in learner feedback, monitor engagement trends, and adjust your training strategy for better outcomes.
Keep learning: Online course evaluation surveys: 3 smart ways to get course feedback
An LMS dashboard is necessary for strategic decision-making because it offers a consolidated view of your academy’s performance.
The dashboard displays user behavior, enrollment data, and course progress in real time, making it easier for your team to take action on insights. Rather than analyzing raw data manually, the dashboard centralizes valuable insights in a visual format.
Implementing learning analytics tools starts with identifying what you want to measure—be it course engagement, dropout rates, or time spent per lesson. Once clear, you can set up tracking through built-in LMS features or integrations with external tools that can pull user reporting into a single platform.
LMS analytics give you the information needed to make informed decisions, but only if used effectively. Follow these best practices for analyzing your LMS reports:
- Start with clear goals: Define what you want to measure—course completion, user engagement, or learner feedback.
- Use segmentation: Break down data by user group, course, or registration date for a targeted analysis.
- Combine data sources: Cross-reference LMS data with learner feedback and other internal metrics for context.
- Monitor trends over time: Track your learning experience by comparing metrics across weeks or months.
- Focus on actionable insights: Prioritize findings that lead to real improvements in content or user outcomes.
LMS analytics offer insights into how learners engage with your content—from time spent on lessons to quiz performance. This capability allows you to adjust content delivery for higher retention and better outcomes.
Over time, analytics make it possible to optimize every touchpoint of the learning experience based on real-time data.
LearnWorlds supports a variety of LMS reports designed to track user performance, registration activity, and course progress. Examples include:
- Overall user progress reports
- Segment-based reports or custom reports using advanced filters
- Other types of reports (product insights, training matrices, etc.)
You can export insights, segment your audience, and tailor training based on users’ reporting patterns.
Yes, LMS reports in LearnWorlds can be exported and scheduled for delivery via email. This feature is useful when coordinating across departments or when corporate clients require updates on training impact.
Exporting supports multiple formats and preserves all relevant filters, ensuring real-time insights are shared without delay.
Learn more about LearnWorlds’s features.
You can track comprehensive learning metrics, including course completion rates, time spent on content, assessment scores, user engagement levels, enrollment patterns, drop-off points (percentage of dropped-out users), video interaction rates, quiz performance, survey responses, and social learning interactions. LearnWorlds provides 24+ different chart types and 95+ filters to segment this data by user role, location, course, date range, and activity type.
LearnWorlds stands out with AI-powered analytics through its AI Insights Hub, which acts as a data analyst answering questions about your academy in natural language. Unlike basic LMS platforms, LearnWorlds offers dedicated course dashboards, radar charts for top-performing courses, real-time data visualization, and the ability to export and automate report distribution to stakeholders.
Yes, LearnWorlds allows you to automate report distribution by scheduling reports to be extracted and emailed to stakeholders automatically. You can set up recurring reports, apply custom filters, choose specific metrics, and deliver insights to team members, partners, or clients without manual intervention.
An LMS analytics dashboard is a centralized visual interface that displays key learning metrics in real-time. LearnWorlds’ dashboard shows user behavior, enrollment data, course progress, engagement trends, and financial metrics in an easy-to-understand format, eliminating the need to manually analyze raw data.
You get to benefit from LearnWorlds analytics and reporting at no additional cost. The platform has analytics and reporting features built into all paid plans, but higher plans come with advanced capabilities.
LearnWorlds offers the following three flexible pricing options:
- Starter – $29/month (basic progress tracking and user insights)
- Pro Trainer – $99/month (advanced segmentation)
- Learning Center – $299/month(scheduled reports + full analytics suite)
All plans include a 30‑day free trial so you can explore powerful LMS dashboards, reports, and AI‑powered insights before committing.
View all LearnWorlds pricing plans.
Yes, it connects with Google Analytics and other popular tools. Explore the full list of LearnWorlds’ integrations.
You can export your reports in CSV or XLS (Excel) formats. Also, by using our API, you can export all data relevant to your users’ progress within your school (available in our Learning Center plan and higher plans).
Loved by data-driven academies worldwide
- 4.8/5 average rating from customers on independent review platforms
- 500,000+ courses created using the LearnWorlds platform
- 15+ in-depth customer case studies, from SaaS to consulting and education, many highlighting analytics & reporting outcomes
Explore how companies like Konsultori, Blip, and Workable use LearnWorlds to grow revenue, speed up onboarding, and reduce support tickets.

Published:
Last Update: