
Table of Contents
Can you afford to ignore what your students do in your own school?
You have created your area of influence, your organization, your brand, your audience with sweat and tears and a great deal of pride. You also opened your online school to expand your reach online.
Given your entrepreneurial spirit, you want to know how to optimize it and grow it.
How will you grow your offering? How do you run continuous improvement? Are enrollments and partial feedback enough elements to make a decision?
Here’s where analytics come into play
You need to make smart decisions. And smart decisions are based on data. When you teach online, “Reading the room” is not a feasible solution to decide on your next steps. Instead, you will need data insights about your e-learning consumption.
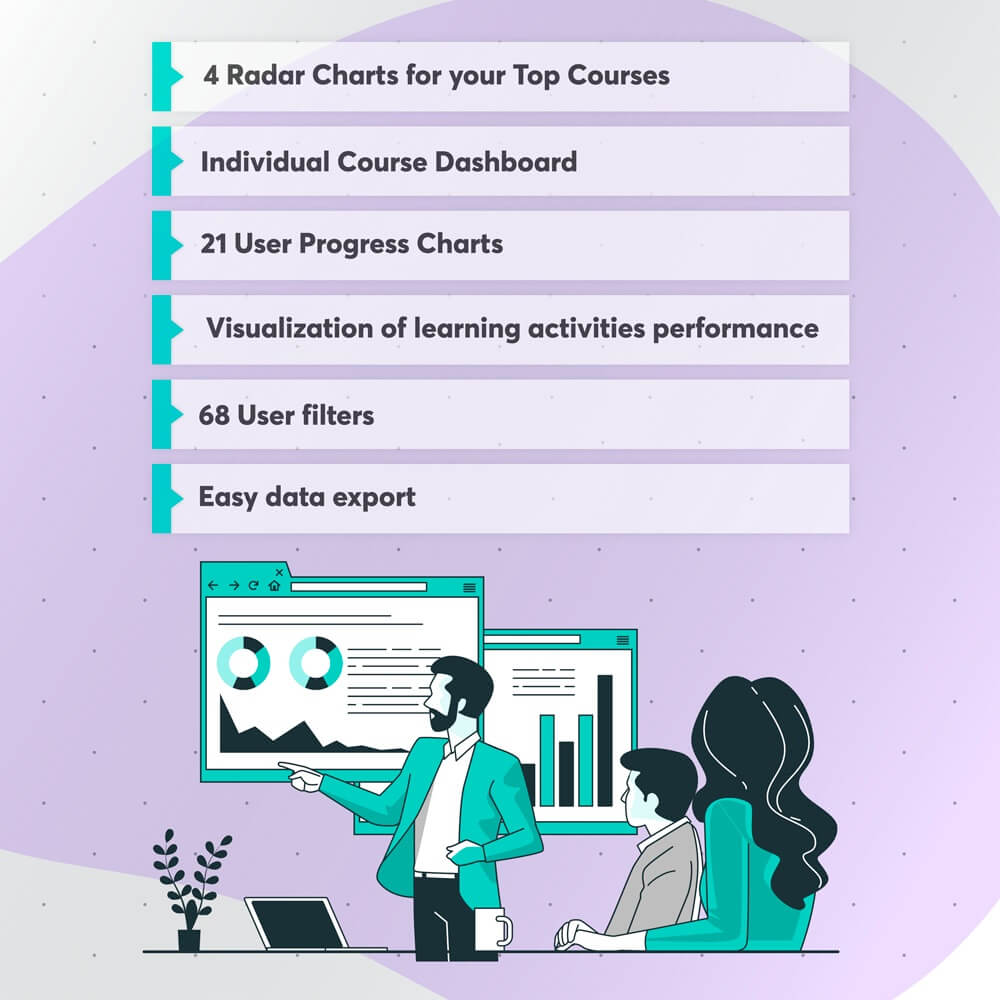
Introducing: LearnWorlds Course Insights
Course Insights is the only eLearning data analysis and visualization tool that helps you make instructional and business decisions.
It offers a state-of-the-art visualization and insights into your course and students. It’s great to quickly understand how your students interact with your course, find bottlenecks and improve the quality of your course.
LearnWorlds Course Insights provides you with in-depth intelligence on how your school performs, so you can be confident while making business and instructional decisions.
With this arsenal at your fingertips, you will tackle the most challenging instructional design and business decisions!
When “reading the room” is no longer a solution, you need data about your students’ content fruition habits in your eLearning school. To decide whether and how to upsell, retire, or revamp, you will need data. Luckily, LearnWorlds Course Insights is here to help you.
Let’s take a look at this uniquely advanced tool.
Course Insights Dashboard
Which courses spark the most social interactions?
Which courses require improvement?
The Dashboard helps you take the pulse of your school by highlighting your four top courses with radar charts based on five key variables:
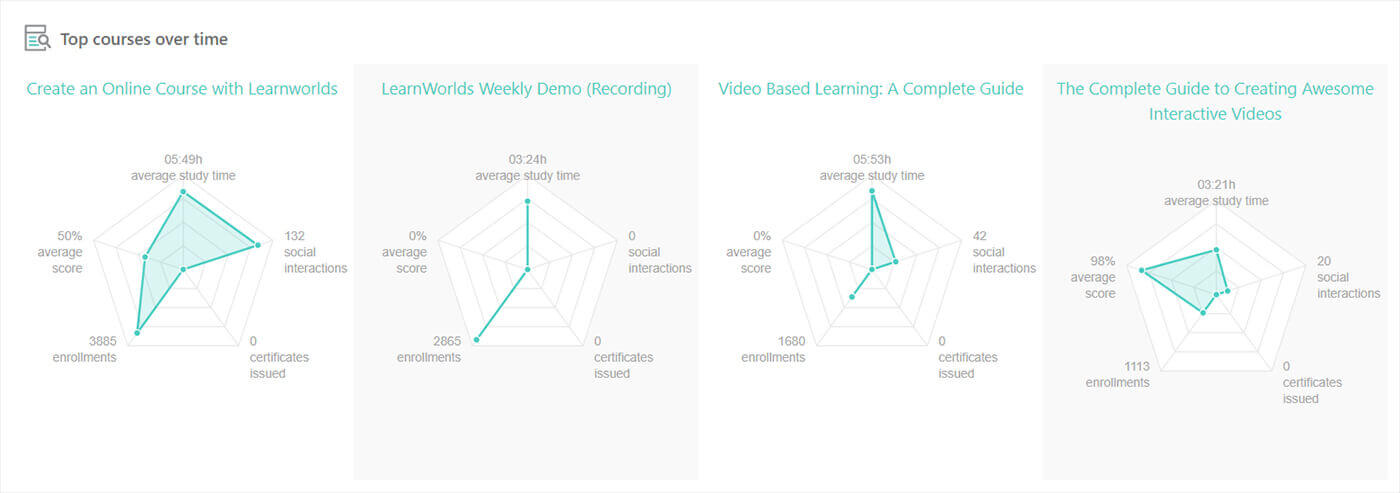
The radar charts are a fantastic way to compare your top four courses. At a glance, you can gauge which elements make them so loved and form an idea on how you could apply the same success formula to other courses in your school.
Under the “All courses” tab, you will be able to order all your courses by the number of learners, average study time, social interactions, certificates issued, average score, and success rate. And this is just the beginning!
Select any course you want and deep dive right into the insights that LearnWorlds provides you.
Specific Course Insights
Once you select any of your courses, you’re ready to dive right into the most constructive information arranged in three dimensions: overall interaction metrics, learning activities performance, and user segments.
Overall Metrics
And on what to focus?
How quickly are students progressing?
What are the learning activities are preferred by your audience?
Here you can see how your learners interact with the course.
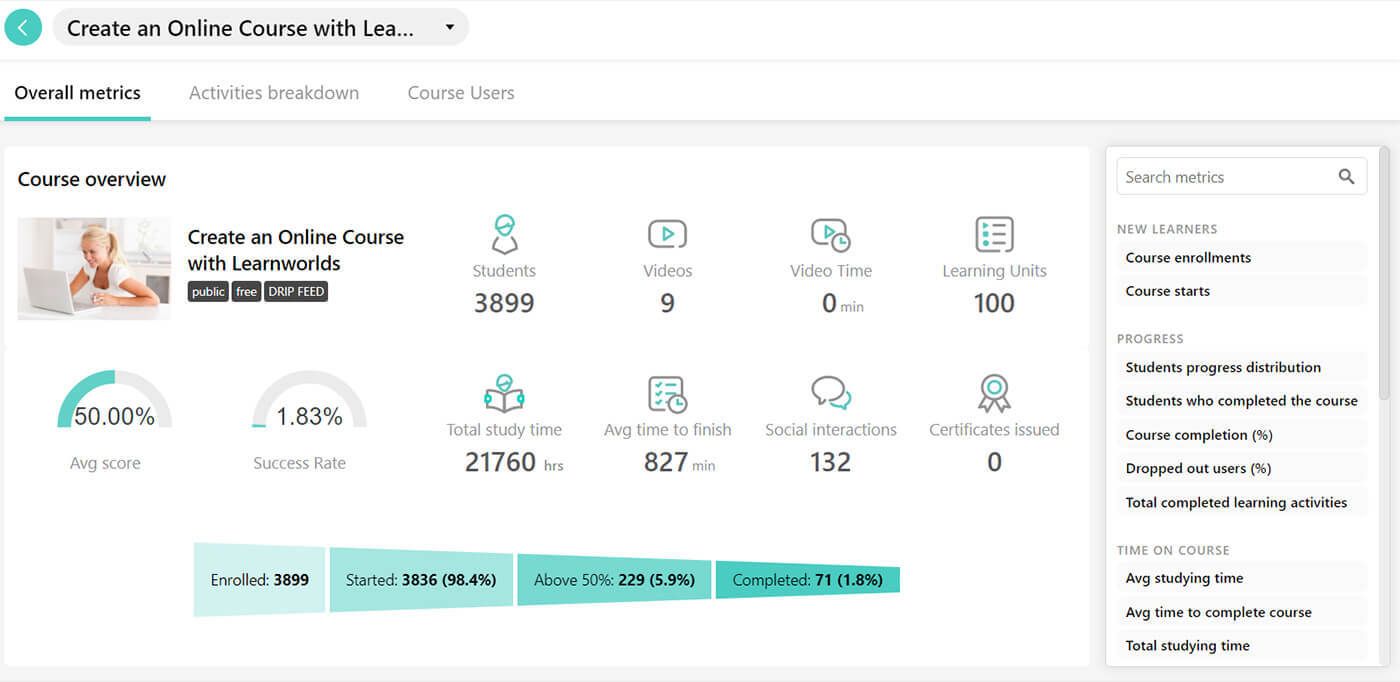
You can use this information to make both business and instructional decisions. For example, you can assess how quickly your learners are progressing, where they are getting stuck, or if your assessments are on point.
You can derive smart decisions by monitoring these 21 data points:
| Course enrollments | Course started | User progress |
| Users who completed the course | Users who completed the course (%) | Dropped out users (%) |
| Number of completed units | Average studying time | Average time to complete course |
| Total studying time | Scores distribution | Best students |
| Worst students | Average score | Average assignment score |
| Average certification score | Number of tests submitted overtime | Number of assignments submitted over time |
| Number of scored certificates and certificates of completion | Number of certifications of completion | Number of scored certificates |
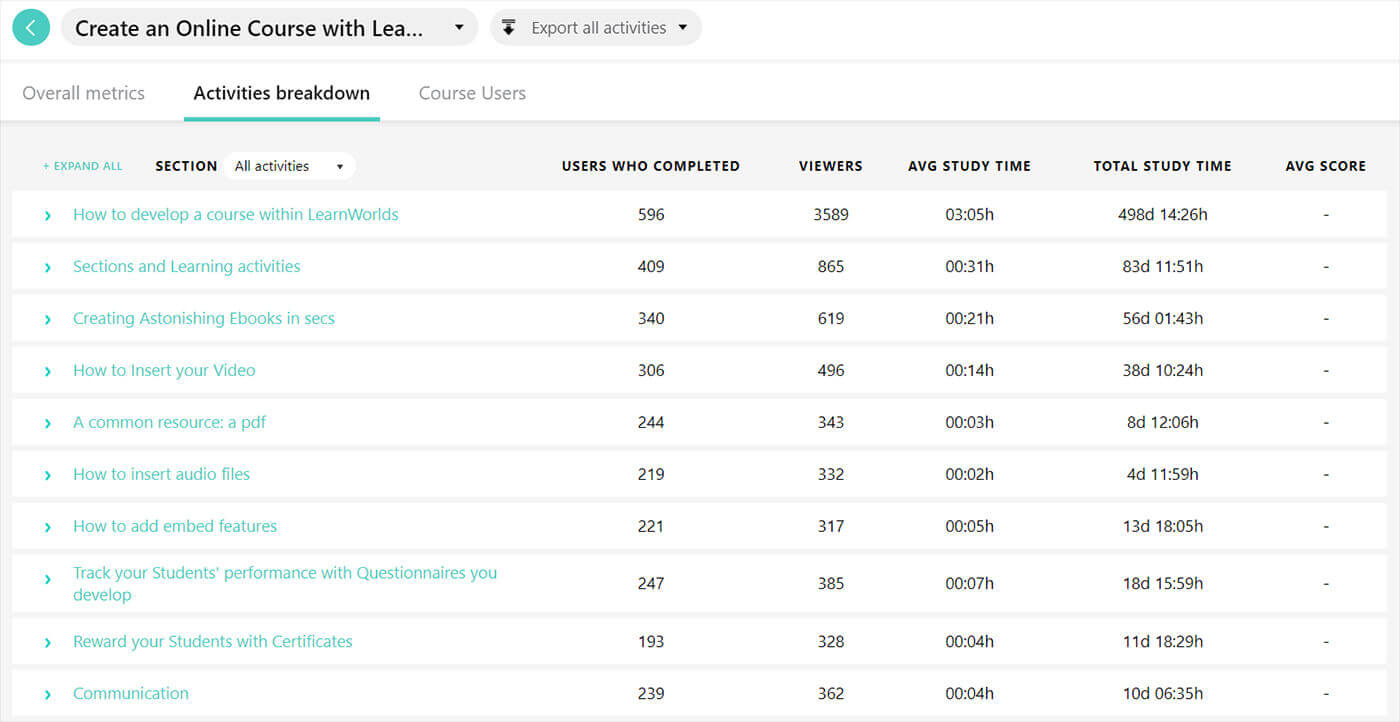
Activities Breakdown
Is there any gap that needs filling?
Is the learners’ study time matching your expectations?
This dimension shows how the course is structured and provides you with a base for decisions around the course structure itself: learning activities flow, balancing the time between course sections and learning units, assessments, tests, and more.
The data points that you will find are:
| Learning units participation | All views of units | Unique views of units |
Course users
Which learners are returning clients?
Which marketing campaign is linked to a higher completion rate?
The third dimension is all about your audience. You can segment your users based on multiple filters, like their characteristics, interaction, engagement, and lead attribution (i.e. UTM codes to track where your users are coming from). You can also combine different filters and tag the corresponding users.
This function gives you the power to know your audience. You can create groups that will be receptive to upselling, isolate inactive students to re-engage them, or select those who dropped out to survey them. You may even evaluate how many users enrolled on the back of a specific marketing campaign!
We have up to 68 different filters that you can use and combine!
Sixteen of them are brand new! Check them out:
| Are enrolled in course between dates | Have started course between dates | Have completed course between dates | Have completed any unit in course between dates |
| Have viewed any unit in course between dates | Have viewed specific unit in course | Have submitted an assignment or test or certificate | Have submitted an assignment |
| Have submitted a test | Have issued a scored or non scored certificate | Have issued a scored certificate | Have issued a non scored certificate |
| Have posted a post on course | Have liked a post on course | Have commented on a post on course | Have liked a comment on a post on course |
Decision-making made easy
Examining data enables you to know what’s going on in your school and act accordingly. You can work on improving your learners’ retention and completion rates, up-selling, cross-selling, and boosting advocacy.
Once you have the data to understand your business in-depth, you have what you need to make decisions. You may be facing one of these four scenarios:
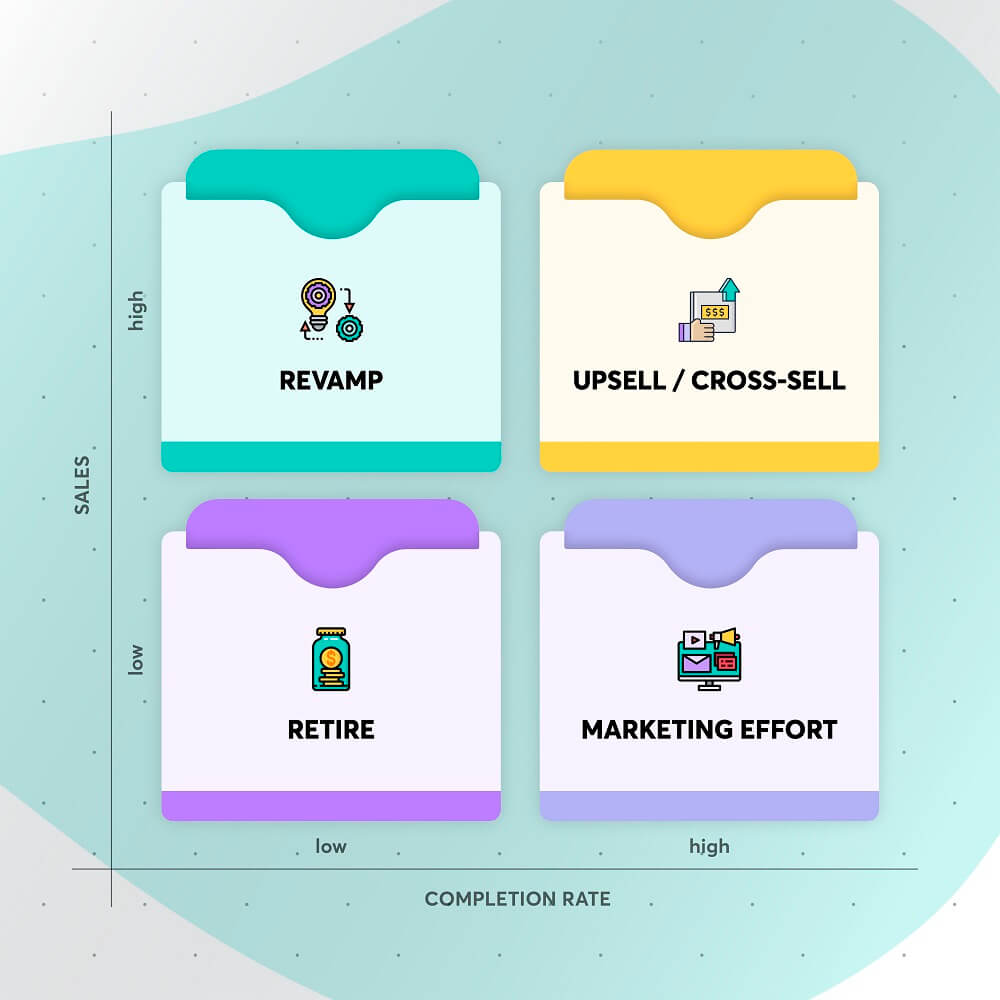
You can use LearnWorlds Course Insights to understand precisely where you stand and optimize your content for instructional and business success. By using data over time, you will be able to adapt when market conditions change and future proof your business.

Sara Cortellazzi
Sara is on a mission to keep up to speed the LearnWorlds' community with the latest feature releases and more. She lived and traveled all around Europe, gaining an MSc in Marketing, experience in tech, and passion for education.
Related Articles