

Table of Contents
Key takeaways
- Get a consolidated view of your revenue performance by tracking gross and net revenue, refunds, commissions, payment methods, and pricing models in one place.
- Understand what’s driving growth with subscription insights like MRR, churn, retention, trial conversions, and revenue movements.
- Analyze and share data faster using built-in filters, comparisons, and exports to uncover trends without relying on spreadsheets.
Most online schools don’t look at revenue in one place. Your payment gateway shows part of the picture, but it only tracks the payments that go through it.
But what if your school uses more than one gateway? What if you sell subscriptions or installments, manually enroll learners after collecting payment elsewhere, pay instructor and affiliate commissions, and still need a spreadsheet to make sense of it all?
Sales Analytics is a new reporting area that helps you track gross and net revenue, monitor refunds and commissions, compare pricing models, understand payment methods and geographies, and, if you sell subscriptions, measure MRR, churn, retention, and trial conversion.
So instead of checking separate lists and exports just to answer basic business questions, you can start with the dashboards already connected to your school’s sales activity.
The questions Sales Analytics helps you answer
Sales Analytics is built for the questions operators actually ask when they’re trying to understand performance:
- Are we growing in net revenue, or just collecting more gross revenue?
- Why did net revenue drop this month?
- Are refunds becoming a problem?
- Are subscriptions, installments, or one-time payments driving more revenue?
- Which payment methods are learners using?
- Which countries are generating the most revenue?
- Is growth being limited by new revenue, churn, or both?
These are the types of questions that numbers alone in a spreadsheet won’t answer without manual work and expertise, but a holistic view in a dedicated dynamic dashboard will.
Start with Revenue Overview
The Revenue Overview reports help you understand your school’s revenue and payment performance over time.
You can review:
- Gross vs Net Revenue: compare total revenue generated with revenue after deductions such as taxes, refunds, affiliate commissions, and instructor revenue.
- Pricing models performance to see how one-time payments, installments, and subscriptions contribute to gross revenue.
- Refunds to monitor refunded revenue and refund count over time.
- Commissions to review instructor and affiliate commission trends.
- Payment Methods to understand how learners pay, including multiple gateways and offline payments.
- Geographies to see your top-performing countries by revenue.
This gives you a practical way to investigate changes. If net revenue drops, you can check whether refunds increased.
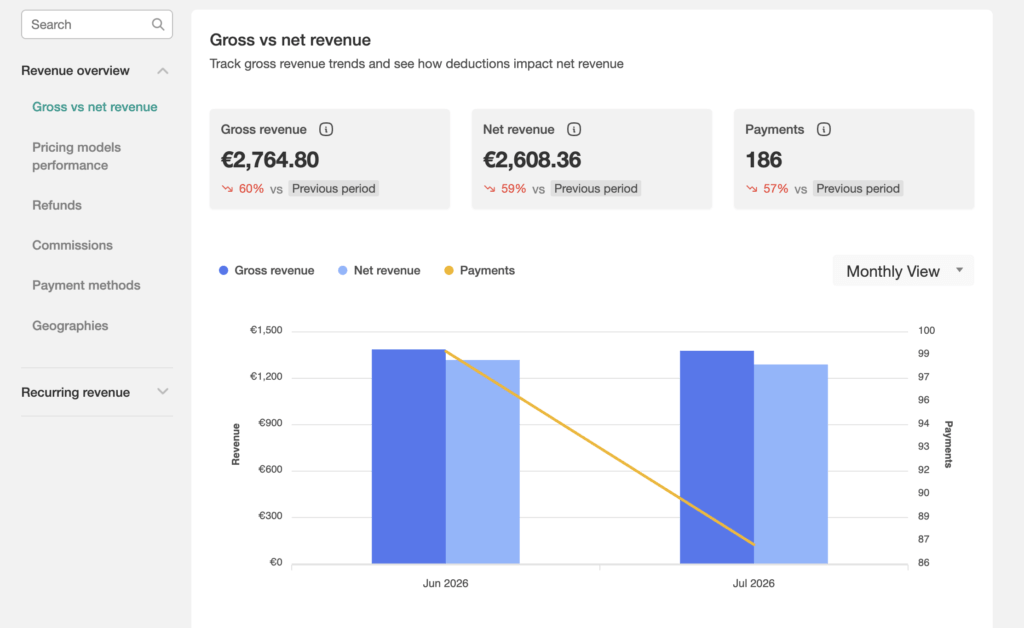
If subscriptions are taking a larger share of revenue, you can look at whether that shift supports your monetization strategy. If one country is performing especially well, you can use that signal for localization, pricing, or campaigns.
Go deeper on subscriptions
If subscriptions are part of your business model, Sales Analytics also includes Recurring Revenue & Subscriptions dashboards.
These reports help you understand not just how much recurring revenue you have, but what’s changing it.
You can review:
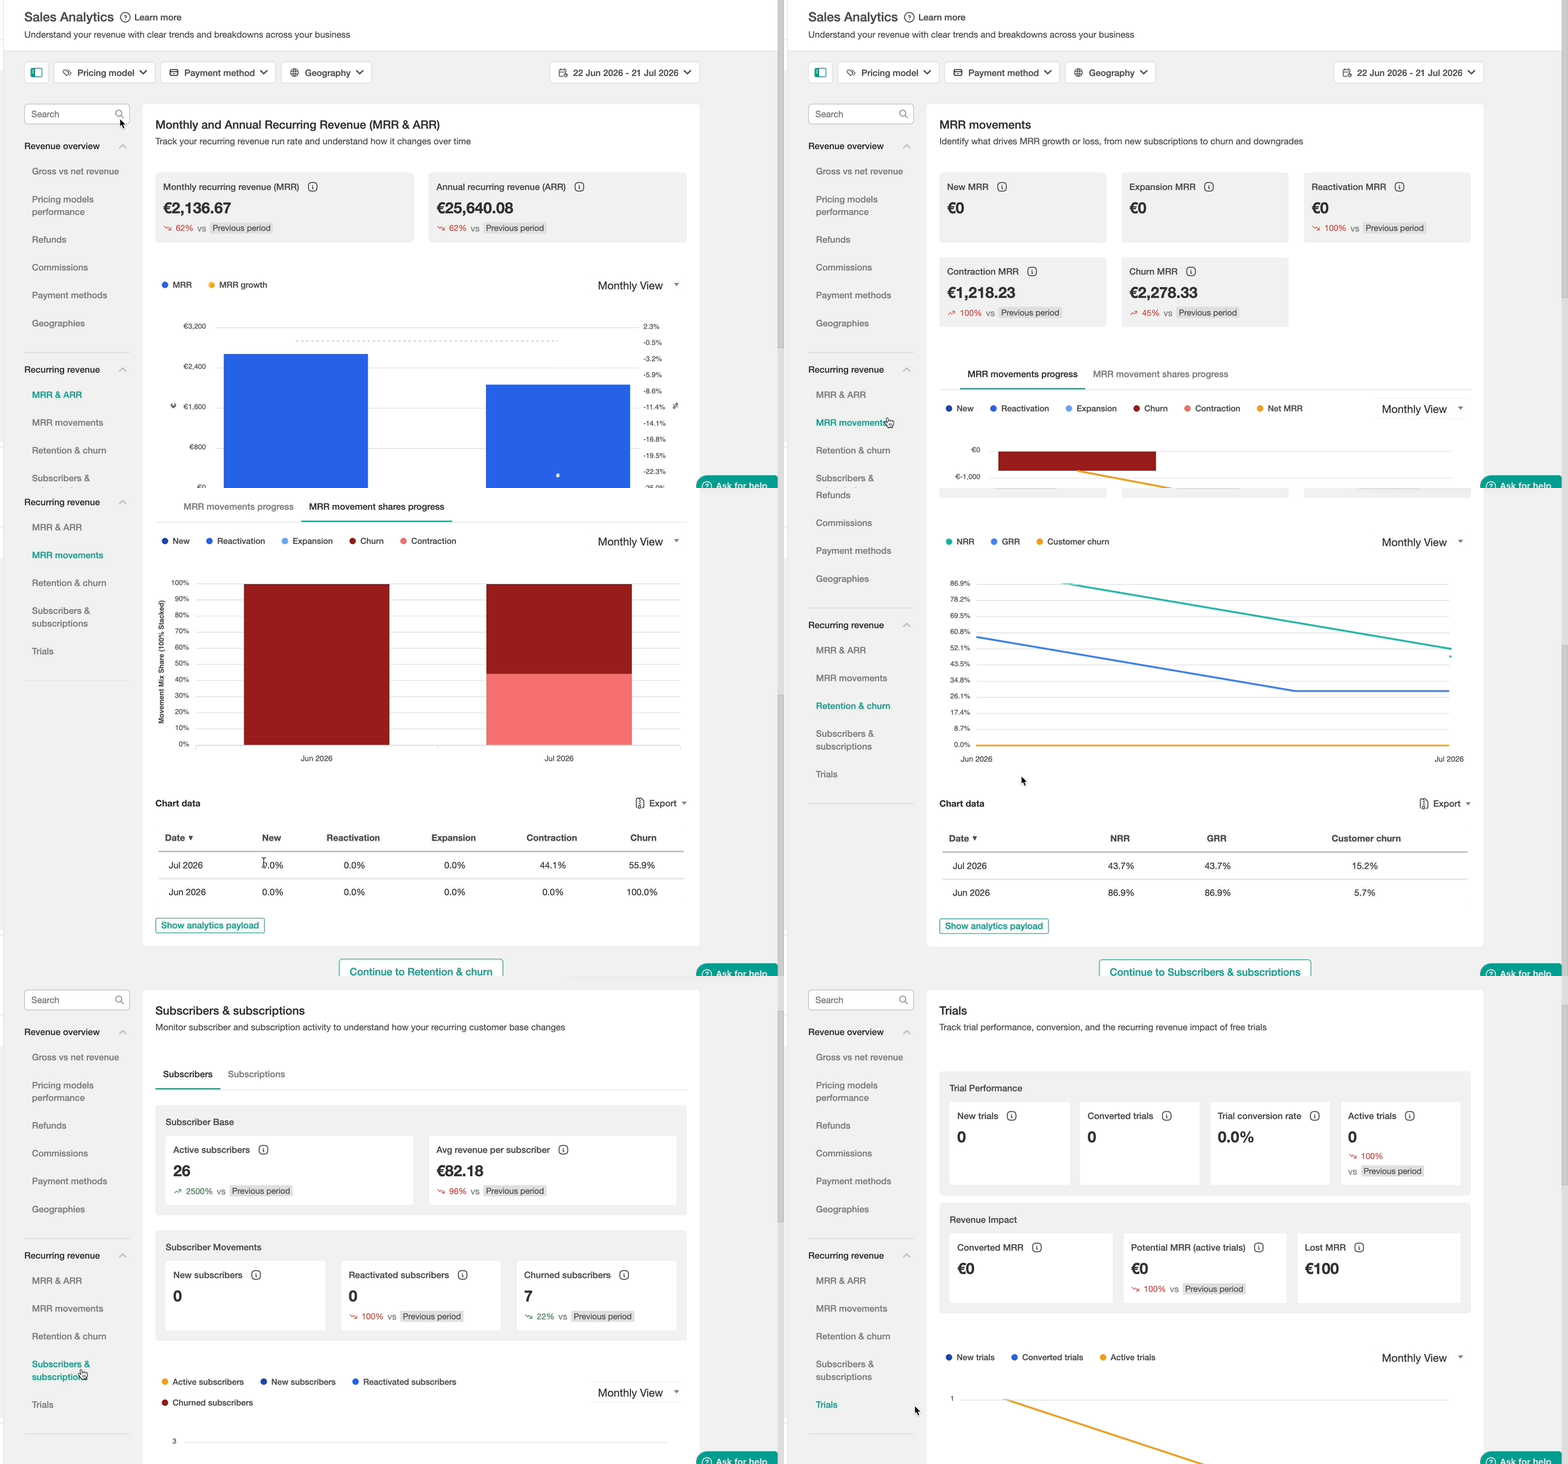
- MRR & ARR to see the normalized monthly value of active subscriptions and the annualized run rate.
- MRR Movements to understand New MRR, Expansion MRR, Reactivation MRR, Contraction MRR, and Churn MRR.
- Retention & Churn to measure Gross Revenue Retention, Net Revenue Retention, and Customer Churn Rate.
- Subscribers & Subscriptions to separate customer-level activity from subscription-level changes.
- Trials to track New Trials, Converted Trials, Trial Conversion Rate, Active Trials, Converted MRR, Potential MRR, and Lost MRR.
A single MRR number doesn’t tell you why it moved.
When running a subscription model business, numbers can be tricky:
- MRR can increase while churn also increases if new or expansion revenue is covering the loss.
- Subscriber count can grow while MRR stays flat if new subscribers are choosing lower-value plans.
- A canceled subscription doesn’t always mean a churned customer, because one subscriber can have more than one subscription.
Sales Analytics helps you see those details before they turn into bigger reporting or growth problems.
Useful for different revenue models
If you sell courses, you can compare one-time payments, installments, and subscriptions, then see which model is contributing most to gross revenue.
If you run a training business, you can track revenue by country, payment method, and pricing model, then use exports when you need to reconcile or share reports.
If subscriptions are part of your business model, visibility matters beyond the headline MRR number. You can review subscriber activity, subscription changes, retention, churn, and expansion signals, especially when one customer may hold more than one subscription.
Sales data is only useful when you can explain what it means. That’s what this is for.
Filter, compare, and export
Filters and export options are built into every report, so you can cut the data the way you actually think about your business—by date, pricing model, payment method, geography, or currency.
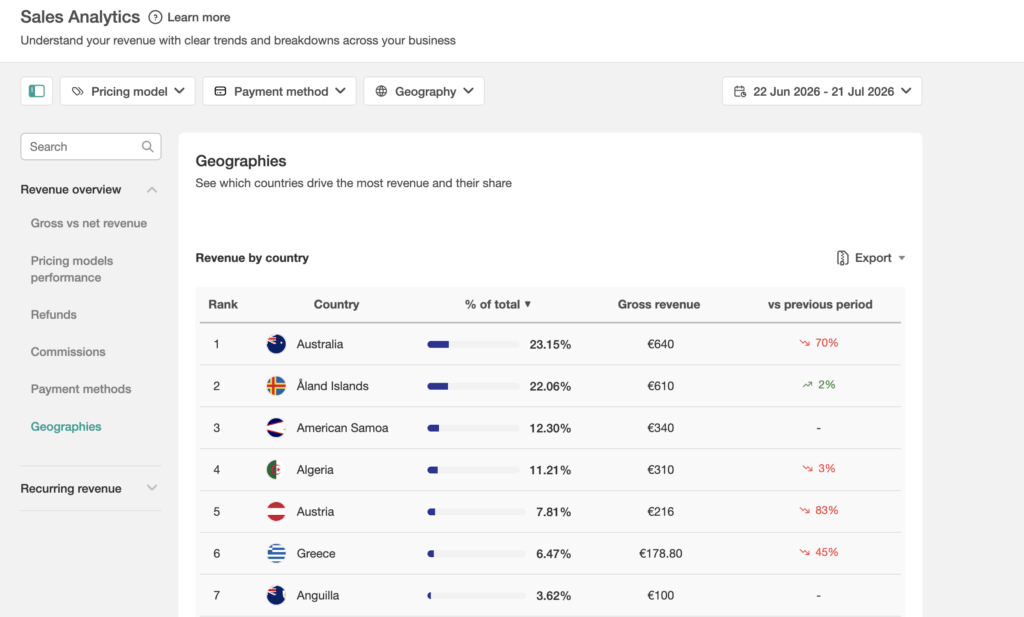
Charts can be viewed daily, weekly, or monthly, depending on whether you’re investigating a specific moment or reviewing a longer trend. When you’re done, export as CSV or XLS/XLSX with your filters and date range intact.
Availability and access
Sales Analytics is available on Beta for Learning Center and higher plans. You can find it in your admin dashboard under:
Reports → Sales Analytics
Users need the View sales analytics permission to access Sales Analytics. Exporting requires the Export sales analytics permission.
Make revenue easier to explain
Revenue reporting shouldn’t require a scavenger hunt. The data you need to explain a down month, a refund spike, or a churn pattern is already there. Sales Analytics makes it readable.

Luiza Coimbra
Luiza is a Product Marketer with a passion for technology and entrepreneurship. With a background in content marketing, she helps LearnWorlds' message reach the world. As an avid traveler, she is always seeking inspiration from new places and experiences.
 Back to blog
 Scroll to top
Related Articles