

Table of Contents
Tracking product adoption metrics is essential if you want to build a product users love and stick with. Whether you’re trying to improve onboarding, reduce churn, or scale product-led growth, knowing what to measure is the first step.
In this post, we’ll cover:
What are product adoption metrics? And why they are essential for SaaS companies
Product adoption metrics (sometimes called product adoption KPIs or user adoption metrics) is quantitative data that tracks how users discover a product or features, how and when they start using them, and how they continue to use them over time.
Tracking adoption and product-led metrics is about understanding how users interact with and experience your product. They are key SaaS performance indicators that help you improve customer onboarding and user engagement since day one, reduce churn, and make smarter product decisions that improve adoption rates and bring business growth.
Here’s why they matter.
Power product-led growth
Product-led growth means that your product basically sells itself. Users can try it on their own (usually with a free trial or freemium model), experience its value quickly, and stick with it because it solves a real problem. And since they’re happy with it, they might as well upgrade and spread the word about it.
Measuring metrics helps you spot and improve problematic areas that prevent new users from seeing value and block product-led growth, like a confusing onboarding flow or hidden or hard-to-use features.
They help prevent churn
Product adoption and retention go hand in hand. By keeping an eye on how well users adopt your product or new features, you can identify customers at risk of abandoning the product and reengage them, take steps to improve your product or your onboarding process, and ultimately prevent early churn.
Double down on what works
Adoption metrics help you zero in on the features users love most. Combine that with user feedback and behavior data, and you get a clear picture of what’s driving value and what’s just taking up space or creating unnecessary friction.
This insight helps you double down on what works, refine or remove what doesn’t, and build a better product that matches your customers’ needs.
Grow faster
Understanding which users adopt your product enables you to target high-value customer segments, personalize your marketing strategies, and enhance conversion rates.
11 key product adoption metrics to track
Before anything else, let’s answer one question:
When does product adoption start?
Product adoption starts the moment a user begins to meaningfully interact with your product with the intent to derive value. This means it can start as early as a website visit, measuring signup conversion rates.
For most SaaS and product-led companies, though, product adoption starts when a user signs up or starts a free trial and starts engaging with the product.
With this in mind, we’ve listed below essential metrics to track user adoption and formulas to use. Using product adoption software helps you track a good deal of these.
1. Activation rate
Activation rate measures the percentage of users who sign up and then reach a key milestone that indicates they’ve experienced initial product value (aka the “aha!” moment).
It’s one of the most important early-stage adoption metrics, as it tells you how effectively your onboarding process is guiding new users to value.
And what counts as “activation”?
Depends on your product, but it’s usually a clear, value-driven action like:
2. Feature adoption rate
This metric tracks the percentage of active users who are using a specific feature of your product. It shows whether users are discovering and getting value from key features and helps you understand feature relevance, UI discoverability, and overall product engagement.
3. Time to first action
This is one of the most valuable insights. Time to first action tracks the time it takes for a user to take their first meaningful action after signing up. When users complete their first task fast, this usually indicates a positive initial user experience and a smooth onboarding process.
4. Usage frequency
Usage frequency measures how often users interact with your product within a given time frame. It shows how habitual or frequent the product usage is, but doesn’t compare it to your total user base.
5. Product stickiness
Or
Weekly Active Users (WAU) / Monthly Active Users (MAU)
It measures how “sticky” or habit-forming the product is, ie. how often users return, relative to the size of your monthly user base. An important metric that signifies the product has met user expectations, while also reflecting customer retention and long-term engagement.
6. Retention rate
Retention rate measures the percentage of users who come back and are still active after a certain period of time, like Day 1, Day 7, or Day 30. It shows whether users find lasting value in your product, which is critical for long-term growth and sustainability.
7. Average session duration
This metric tracks the average amount of time users spend in your product per session.
It helps gauge how engaging your product is. Longer sessions may indicate deeper usage, while short ones might signal confusion, friction, or task-oriented use.
8. Cross-feature usage

This metric indicates the number of distinct features users regularly use, suggesting that onboarding introduces new features effectively. More cross-feature usage usually means higher engagement, greater product stickiness, and better long-term retention.
Optional product adoption metrics to keep an eye on
The metrics below are not strictly product adoption metrics, but they do add up to the picture meaningfully and are worth measuring.
9. Tickets per feature
This metric tracks how many support tickets are submitted in relation to a specific feature. High ticket volume can signal that users are trying to adopt a feature but getting stuck. It’s a great diagnostic metric that helps you understand friction points and usability issues.
10. Net Promoter Score (NPS)
Net Promoter Score (NPS) is one of the most common customer success analytics. It’s a user survey that measures customer satisfaction and loyalty by asking users how likely they are to recommend your product on a scale of 0–10.
It helps you gauge overall user sentiment and identify your promoters, passives, and detractors among your user groups, which is key for improving experience and driving word-of-mouth growth.
NPS is a customer sentiment/loyalty metric. It tells you how users feel about your product, not how much or how well they’re using it. You could have:
11. Customer education engagement
Customer education engagement refers to how actively users are engaging with your educational content, such as online courses, tutorials, help docs, webinars, or certifications. It’s a sum of metrics that include course completion rates, frequency of resource center visits, or number of certificates.
While not a core adoption metric on its own, it’s an onboarding performance metric that plays a key supporting role. Higher engagement with educational content often correlates with higher activation, better feature adoption, and reduced support tickets. It also helps users move beyond basic usage and explore more advanced features over time.
👉Find the best customer education platforms in 2025.
How to use product adoption metrics to improve onboarding
You can’t improve what you don’t measure, and that’s especially true for user onboarding. Measuring product adoption metrics doesn’t just tell you if onboarding works, but shows you where it needs fixing.
Here’s how to put those insights to work:
1. Identify friction early
What to do:
2. Highlight the right features
What to do:
3. Build for habit formation
What to do:
4. Catch and fix friction
What to do:
5. Continuously optimize
What to do:
How customer education influences product adoption metrics
Customer education isn’t just a “nice to have” but a core driver of adoption. A well-designed customer education program, help centers, tooltips, tutorials, and knowledge bases help users understand how to use your product and why it matters.
Here’s how:
It speeds up activation and time to value
When users know what to do and why it matters, they get to value faster. Customer education helps reduce the initial learning curve, making it easier for new users to complete onboarding steps, take their first meaningful action, and reach that all-important “aha” moment.
It increases feature adoption
Many features go unused simply because users don’t understand what they do, how to access them, or when to use them. Education content, like tooltips, videos, or use case examples, encourage users to explore more of your product.
It improves retention and stickiness
When users are confident in how to use the product and keep getting value, they’re more likely to return and build a habit. Educational resources also help users to solve problems independently, reducing friction that might otherwise cause them to drop off.
It boosts session quality and usage frequency
If users have clear guidance on how to get the most out of each session, they’re likely to spend more time engaged—not just clicking around, but actually getting stuff done. This leads to more meaningful engagement with the product and more frequent return visits.
It improves CSAT and NPS scores
Educated users need less hand-holding, file fewer support tickets, and generally have a better experience. That means higher satisfaction scores, like NPS. Customers who feel confident and successful are far more likely to recommend your product.
5 tools to measure and track product adoption metrics
A product analytics platform, which is usually part of your user onboarding tool, will help you measure product adoption by analyzing user paths and behavior. Below, you’ll find five top options.
Mixpanel

Mixpanel is a digital analytics platform that helps teams understand user behavior through real-time dashboards and visualizations. With its SDK, you can stream data from any digital product and connect product insights with business performance.
The platform supports goal tracking, cohort analysis, A/B testing, and session replay to surface trends and friction points. Mixpanel’s Warehouse Connectors let you sync data with your warehouse, and its wide range of integrations makes it easy to fit into any modern data stack.
Amplitude
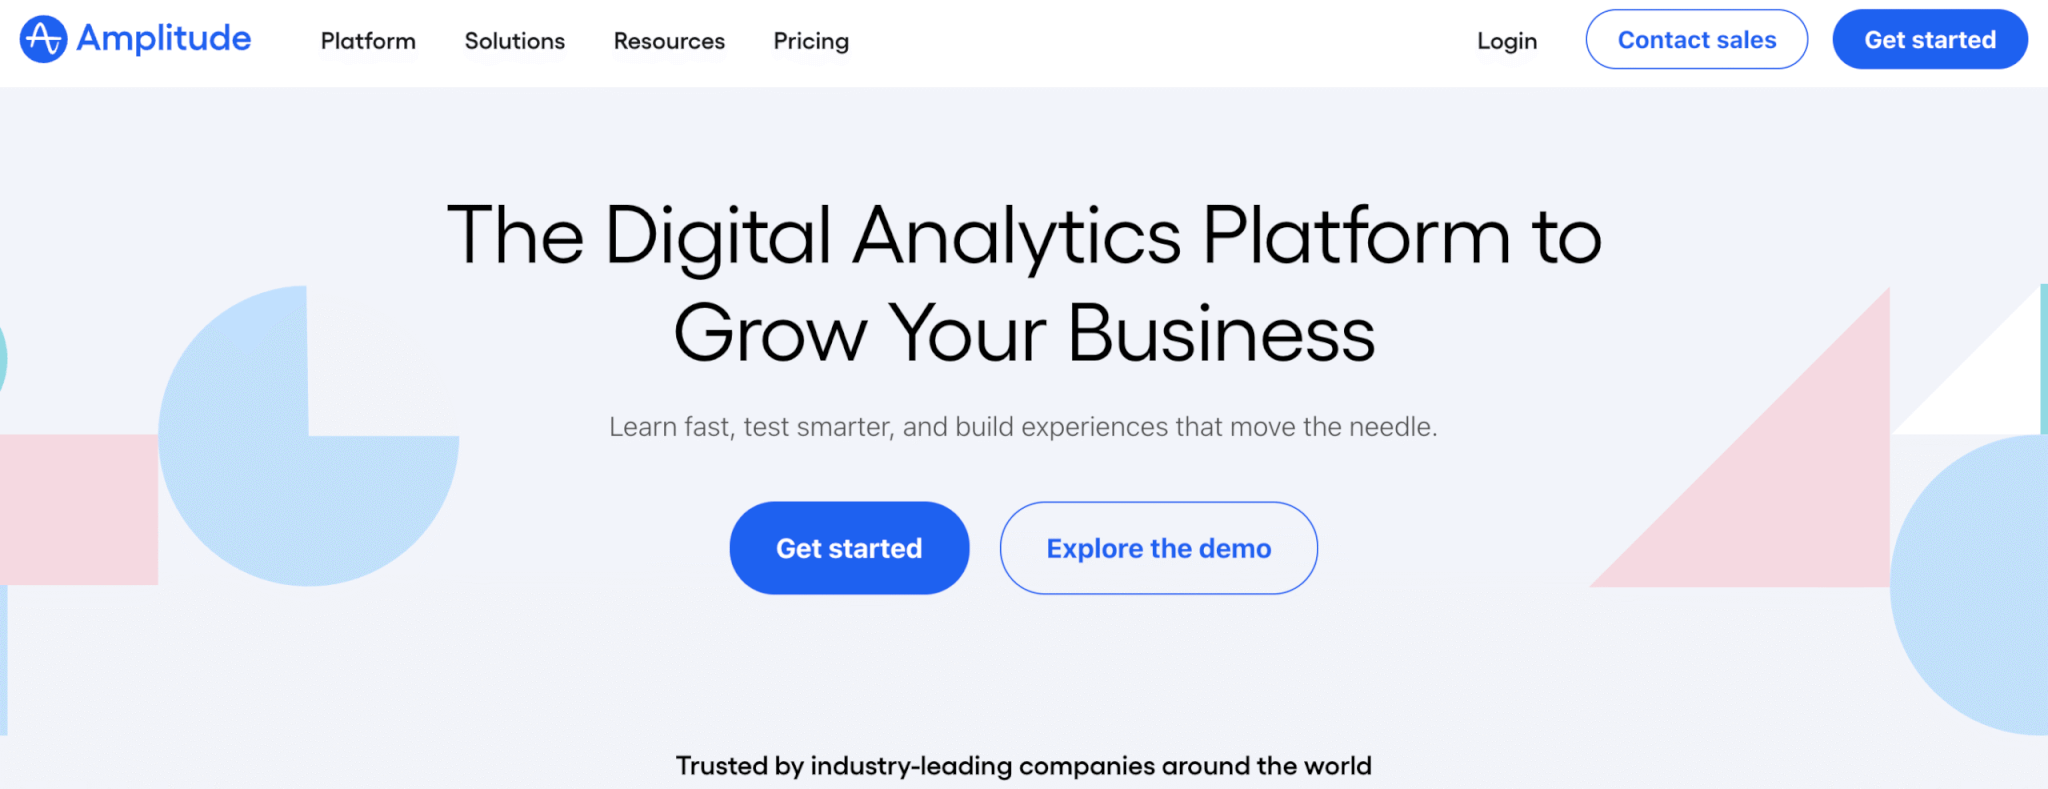
Amplitude is a digital analytics platform that unites all your data with behavioral analytics and AI automation. It allows you to set baseline product reporting, dashboards, and charts with just one line of code and create custom reports with built in templates and charts. Using AI you can directly ask a question about your product and AI will analyze product data and visualize insights.
Amplitude also features product tours, checklists, and announcements and diverse in-app and website surveys, both of which use behavior-based targeting so that they cause no disruption to the user experience. It also allows for more complex reporting like analysis of cross-platform user behavior. Warehouse-native Amplitude lets you run product analytics directly on your own data warehouse—no data syncing or duplication needed.
Appcues
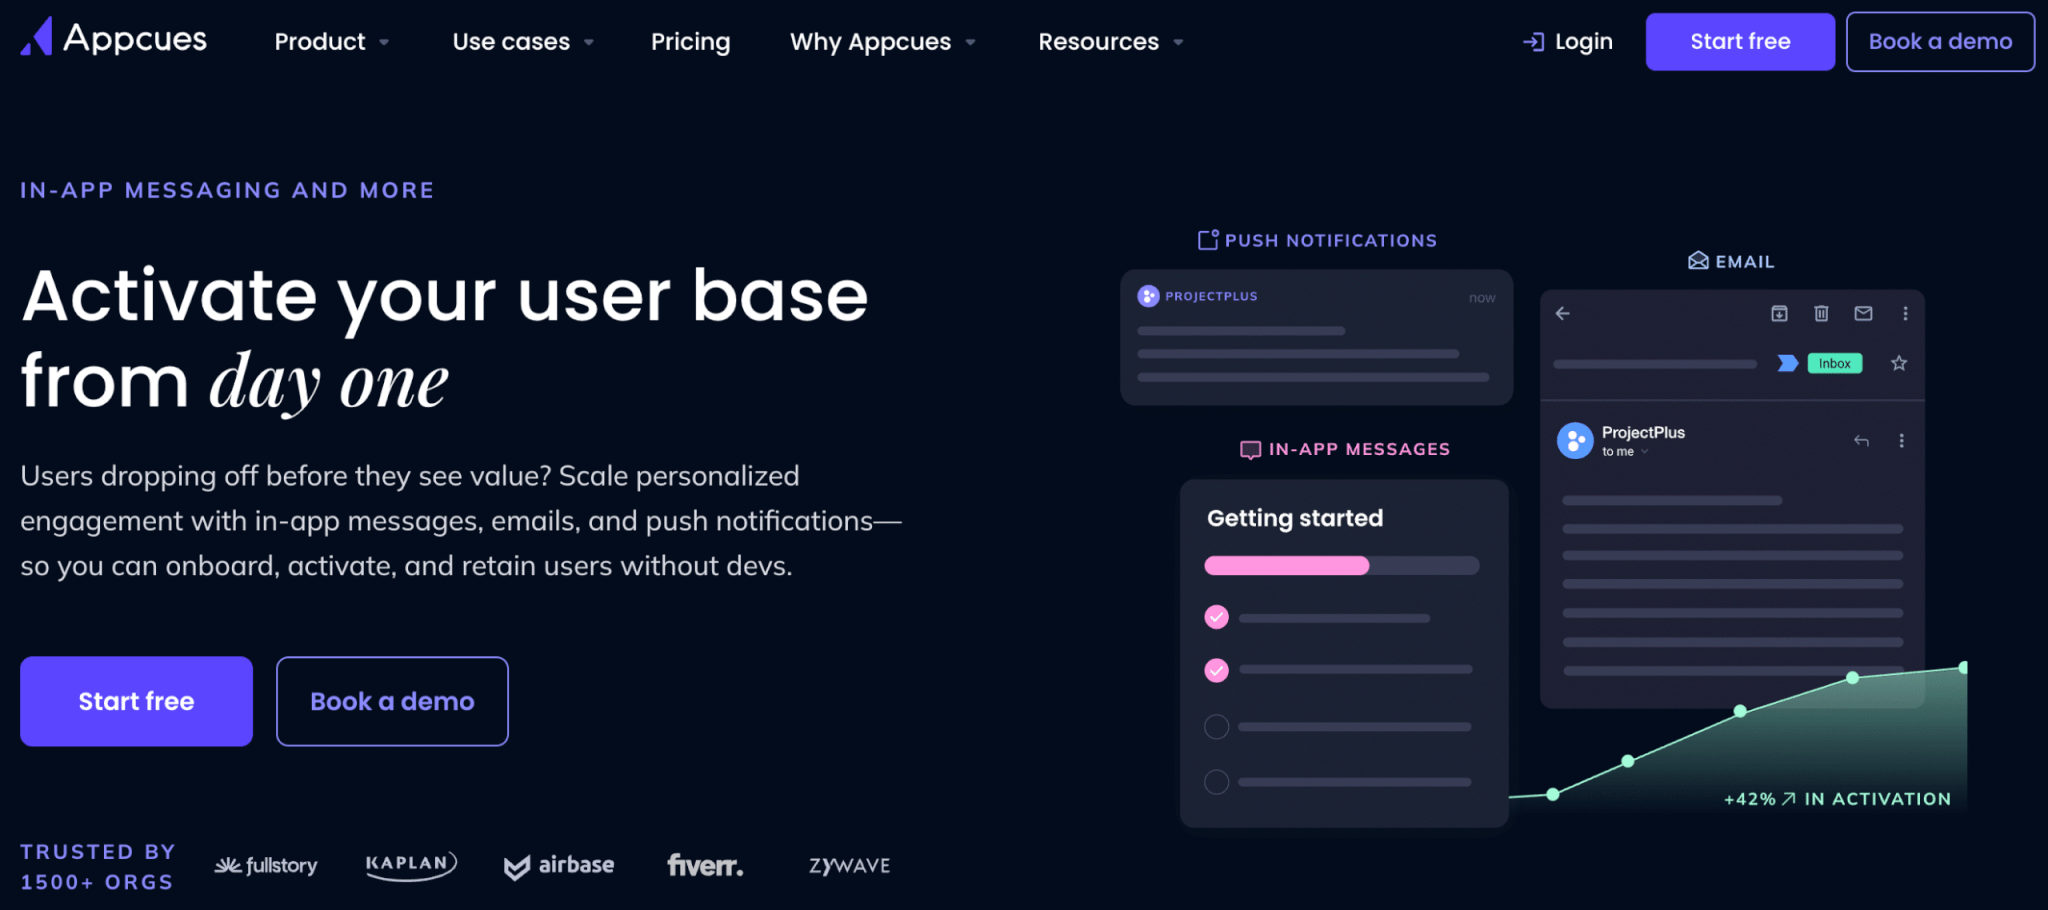
Appcues is a product adoption platform built to boost user activation and engagement. It supports multichannel communication through in-app messages, emails, and push notifications. Key features include onboarding flows, behavior-based checklists, customizable templates, a no-code builder, event tracking, and built-in NPS and feedback tools.
Appcues also offers analytics to track events, user engagement, and segmentation. You can monitor how engagement changes over time by combining event tracking and segmentation, track performance across channels, and set custom goals to measure key user actions.
Gainsight
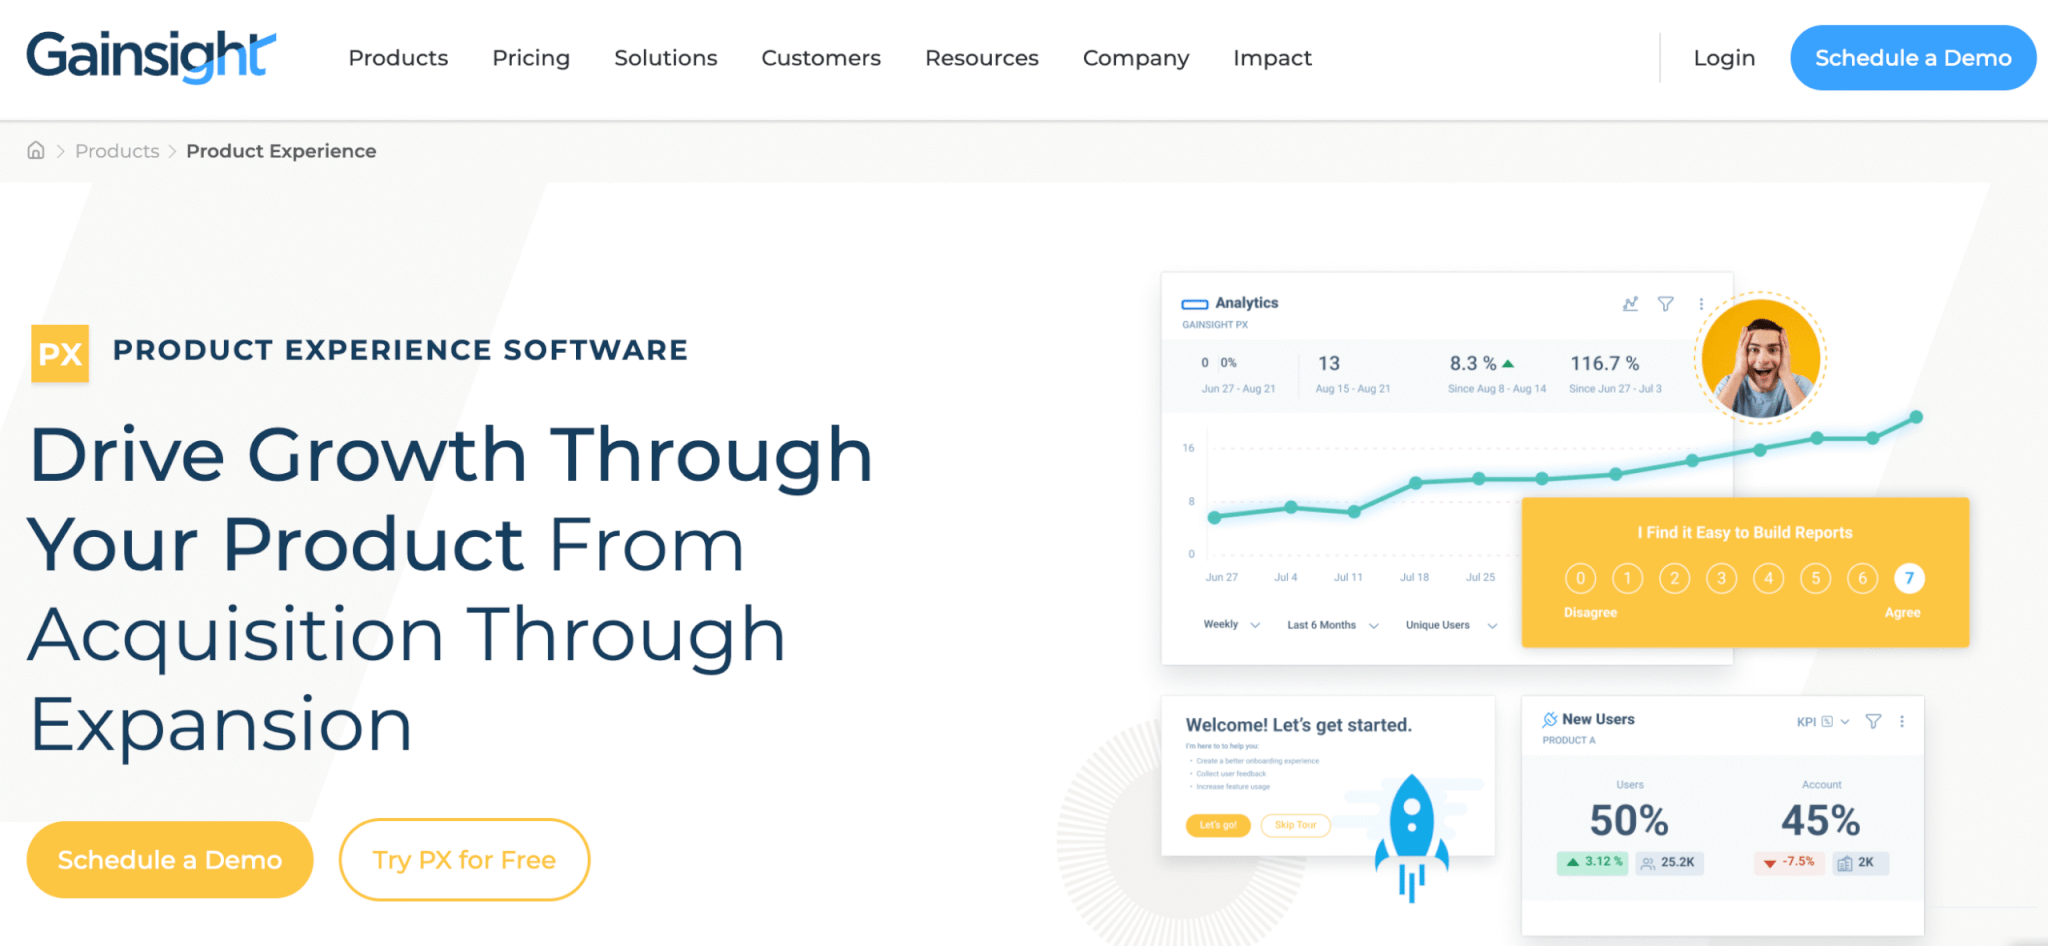
Gainsight is a product experience platform that offers advanced product analytics, including path and funnel analysis, along with native integrations for customer success and CRM tools. It supports a variety of in-app surveys—such as CES (Customer Effort Score) for feature usability, as well as CSAT and NPS surveys.
The platform allows you to build custom dashboards and use AI-powered, automated product mapping. You can also deliver tailored onboarding experiences—both self-paced and in-app—based on user persona, customer health, and product usage data.
Userpilot
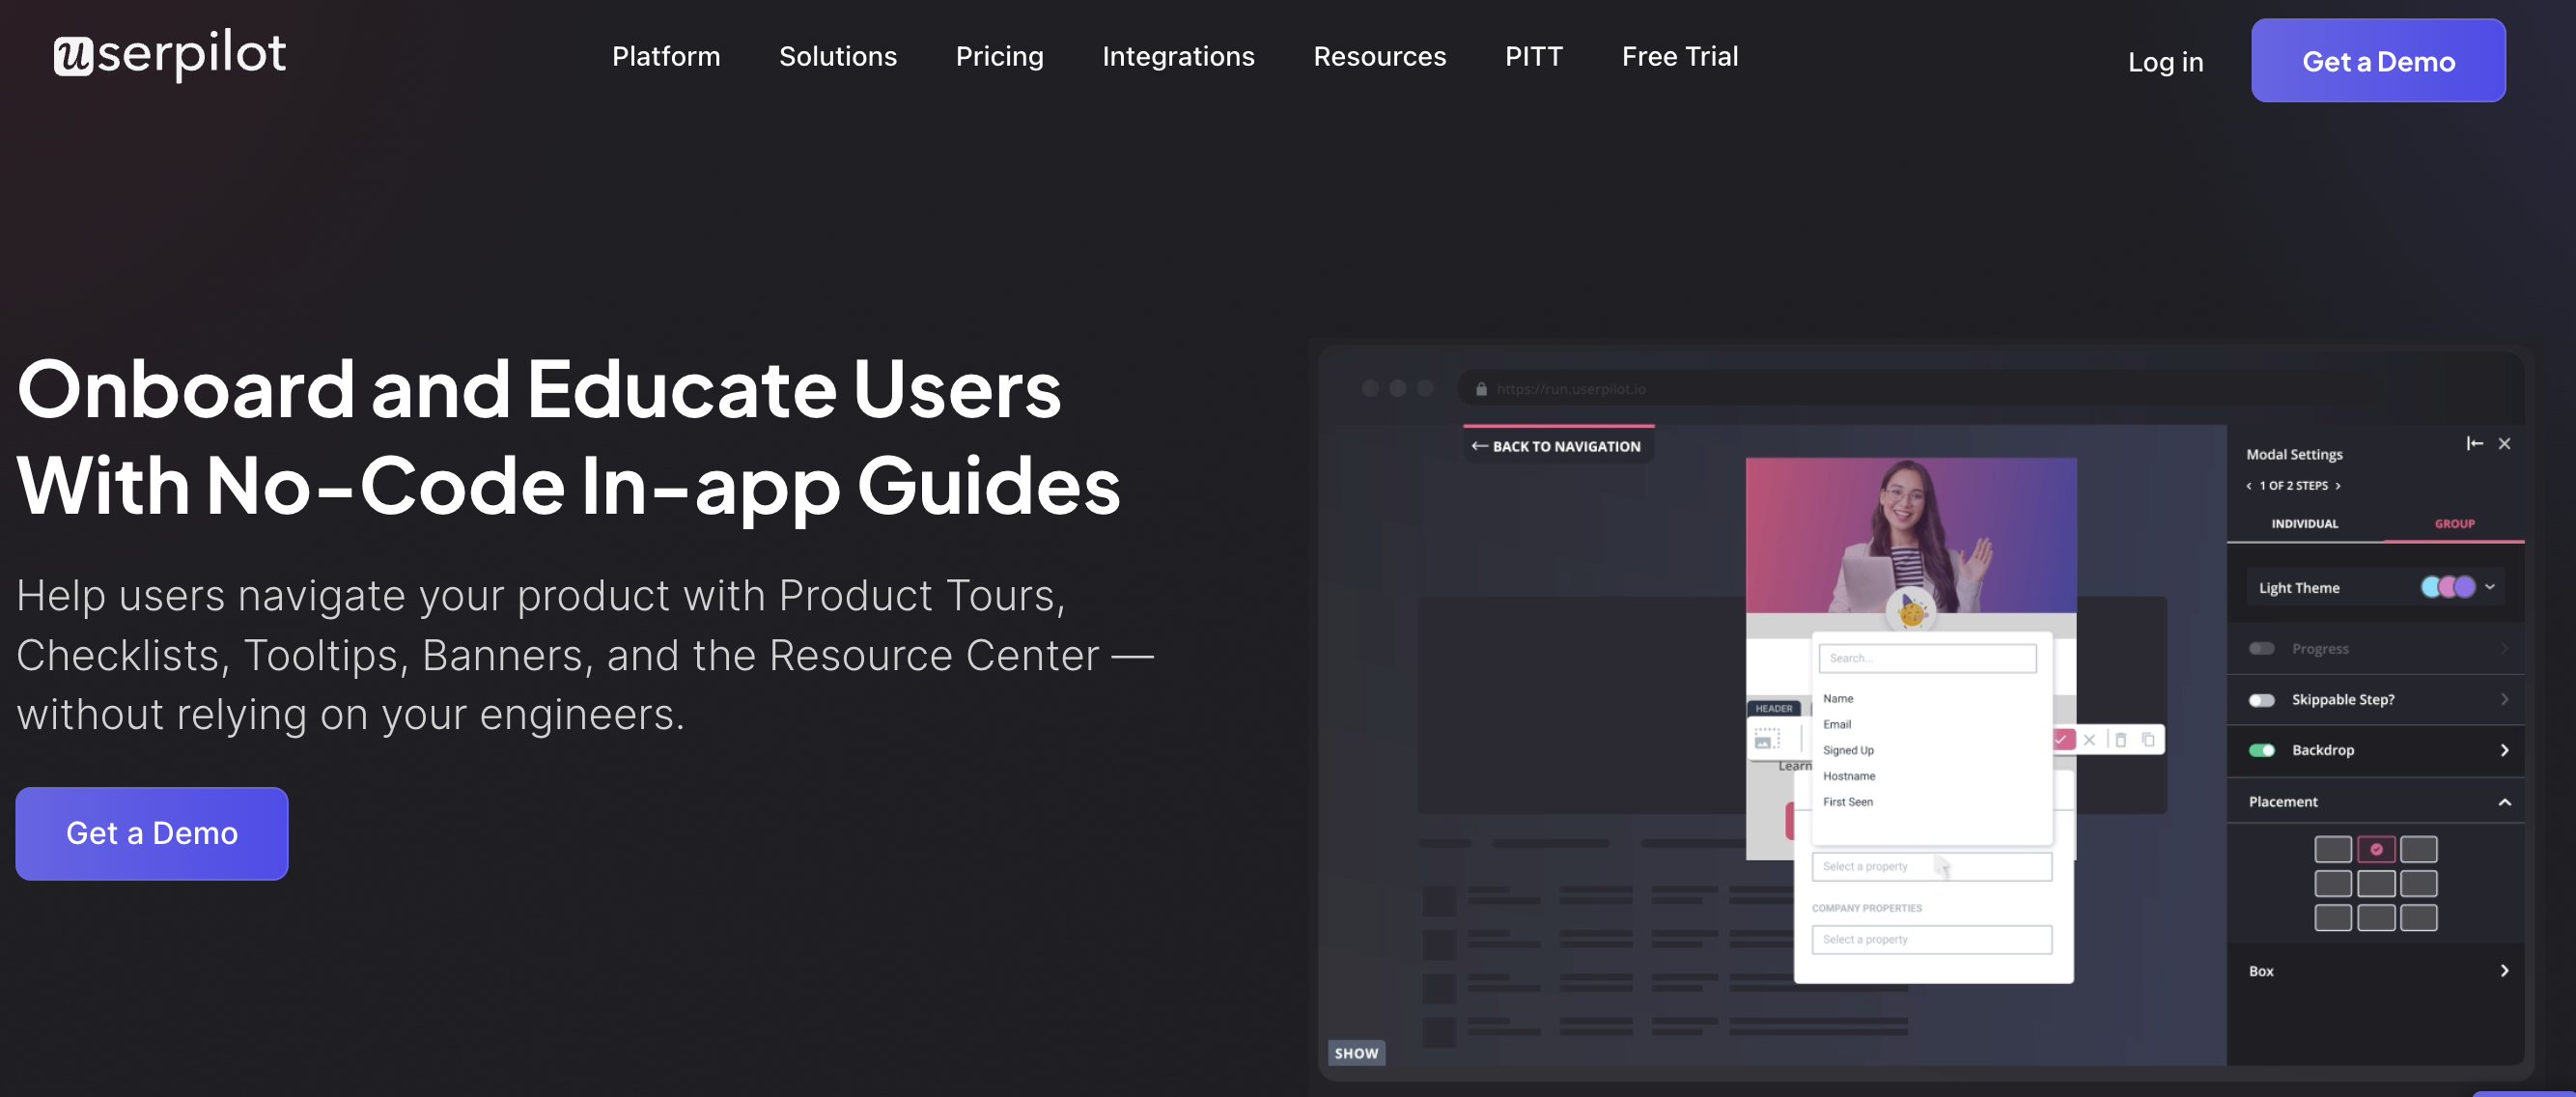
Userpilot is a product growth platform that helps you onboard and engage users through product tours, checklists, tooltips, banners, and a built-in resource center. With detailed segmentation, you can personalize experiences based on user behavior or lifecycle stage. Additional features include session replay, auto-translation, and customizable dashboards—all without code. Built-in feedback tools like NPS, CSAT, CES, and custom surveys can be triggered contextually.
Userpilot also offers robust product analytics, including event autocapture, no-code event tracking, usage trend analysis, funnel and path tracking, and retention analysis by user segment. You can build custom dashboards or use pre-defined templates for product usage, activation, and core feature adoption. Session replay is also included to support behavioral analysis.
Benchmarks and goals for product adoption metrics
Once you start tracking product adoption KPIs, the big question becomes: “Are these numbers good?” Here’s how to think about benchmarks, set realistic goals, and use these metrics to fuel smarter growth.
What good looks like
While benchmarks can vary by product type, industry, and audience, here are some general ballpark ranges to guide you:
| Metric | Aim for | ||
| Activation rate | 40-60% | ||
| Time to first action | 5 minutes max | ||
| Feature adoption rate | 60-80% for core features | ||
| Product stickiness (DAU/MAU) | 20% for B2B, 30-40% for B2C | ||
| Retention (day 30) | 20-30% for B2B, 10-20% for B2C | ||
| Average session duration | 3-10’ depending on use case | ||
| Tickets per feature | Not specific, but should decrease over time | ||
| NPS | 30 is ok, 50 is excellent | ||
How to set realistic targets by company stage
Don’t worry about hitting “best-in-class” benchmarks right away. Your goals should match your stage and strategy.
The key is to baseline your current numbers → set targets for improvement → iterate fast.
How LearnWorlds integrates education into the adoption journey
LearnWorlds is a customer training LMS that makes it easy to embed customer education into every stage of the product experience. By combining structured learning with behavior-based delivery, it helps users understand your product faster, adopt key features, and stay engaged long-term.
Here’s how LearnWorlds supports product adoption through education:
With LearnWorlds, customer education becomes a key part of your user adoption strategy—not just a support layer.
Final thoughts
Tracking the right product adoption metrics gives you the insight you need to build better onboarding, drive engagement, and create a product that users truly stick with. Pair those insights with strong customer education, and you’ve got a powerful recipe for long-term success.
Want to make education a core part of your adoption strategy? Try LearnWorlds and build a fully branded academy your users will love.

Androniki Koumadoraki
Androniki is a Content Writer at LearnWorlds sharing Instructional Design and marketing tips. With solid experience in B2B writing and technical translation, she is passionate about learning and spreading knowledge. She is also an aspiring yogi, a book nerd, and a talented transponster.
FAQ
Everything you have ever wondered, but were too afraid to ask...
Related Articles