Table of Contents
Key takeaways
- Completion tracking shows training happened, not whether it worked. That requires progress tracking mid-program plus effectiveness data tied to business outcomes.
- Each of the five LMS reports (completion, progress, assessment, compliance, engagement) answers a different question for a different stakeholder.
- Common mistakes like treating completion as learning, trusting idle platform time, skipping completion rules, and storing compliance records only in the LMS quietly undermine training data.
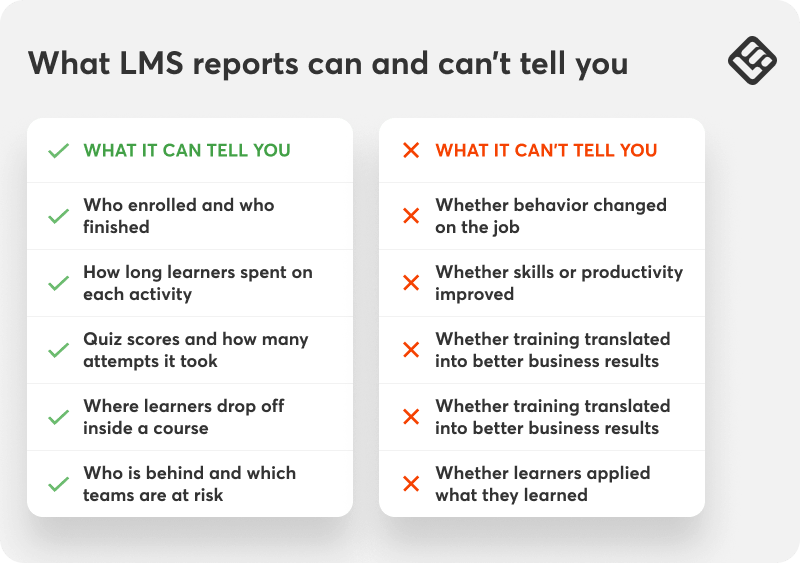
Most L&D and HR managers can tell how many employees enrolled in a course and how many completed it. Far fewer can tell who is behind or which team has a knowledge gap, and what to show leadership when they ask whether training is working.
The reports are there. The problem is knowing which one to pull for which question, and what to do once you have the answer.
This guide covers how to track employee training end-to-end: the methods available, whether or not you have an LMS, how to track progress while a program is running, how to measure whether training actually worked, and which reports to pull to prove it.
If you want to learn how to keep track of employee training, read on.
Why tracking employee training matters (and where most teams get it wrong)
Training you can’t track is training you can’t defend. When a regulator asks for proof that every warehouse employee completed forklift safety training, or when a new VP asks whether the onboarding program is actually shortening ramp-up time, “we ran the sessions” isn’t good enough. You need a record and a metric.
Most teams get tracking wrong in one of two ways.
The first is having no system at all: training happens, attendance is taken on a sign-in sheet or not at all, and nobody can say with confidence who’s current and who isn’t.
The second and more common is having a system that only tracks activity: who logged in, who clicked “complete.” That tells you training happened but tells you nothing about whether it worked, and it’s a weak defense in an audit because a completion checkbox with no supporting date or record is easy to dispute.
ATD’s 2025 State of the Industry report found that most organizations measure training success through employee satisfaction (70%) and retention (62%). These metrics are OK as solid starting points, but far fewer connect training to productivity, customer satisfaction, or revenue.
Tracking is what closes that gap. It’s what turns training from an event into a system, one where you can see who needs support, prove compliance to whoever’s asking, and show whether the time and budget spent were worth it.
Keeping this in mind will help you read the reports that follow accurately and avoid the most common ways LMS data gets misread.
👉 If you’re using LearnWorlds, the Report Center gives you customizable reports with over 95 filters, saved segments, scheduled delivery (for some report types), and a Training Matrix for a visual overview of learner progress across courses.
💡Find out more about LearnWorlds analytics and reports.
4 methods to track employee training
There’s no single “right” way to track employee training. The right method depends on team size, whether training is mandatory or elective, and how much proof you need to produce on demand.
Most organizations use a combination of methods as they grow. Here are a few options.
1. Manual tracking (spreadsheets and forms)
A shared spreadsheet with columns for employee name, course, start date, completion date, and score is the starting point for almost every small team. It costs nothing to set up and works fine for a handful of people and a handful of courses.
The downside to it is that it breaks down fast. Someone has to keep updating it manually every time a person completes something. There’s no automatic reminder for people who fall behind, and it becomes unmanageable once you’re tracking more than one training type across more than a dozen people.
2. HR system integration
If your HR information system (HRIS) already tracks employee records, some platforms let you log training completions as an employee attribute, alongside things like certifications or performance reviews. This keeps training data next to other HR records, which can be convenient for reporting to leadership.
The tradeoff is that most HRIS platforms aren’t built for the granular training needs like module-level progress, quiz scores, time spent, and drop-off points. They’re good for storing the result (“completed: Yes/No, Date: X”) but weak for managing training while it’s in progress.
3. Learning management system (LMS) — recommended for scale
An LMS is purpose-built for this. It tracks enrollment, progress, scores, and completion automatically, in real time, without anyone updating a spreadsheet by hand. It’s the only one of these four methods that scales cleanly past a few dozen employees or more than one or two courses, because the system does the record-keeping instead of a person.
The tradeoff here is often setup time and cost. For a team running one or two ad hoc trainings a year, an LMS is probably overkill. For any team running recurring, mandatory, or compliance training, or planning to scale training as headcount grows, the reporting and audit trail an LMS provides quickly pay for themselves.
4. Dedicated training tracker software
Standalone training tracker tools sit between a spreadsheet and a full LMS. They handle scheduling, completion tracking, and certification expiry reminders without the course-authoring and delivery features of an LMS.
These make sense if training content itself lives elsewhere (in-person sessions, external certification providers) and you mainly need to track that it happened, not host the content.
💡See our guide to training tracking software for employees for a full comparison of dedicated tools.
💡For a closer look at running methods, check how to track employee training without an LMS.
How to track employee training progress with an LMS: 5 steps
Once training is underway, the goal is catching people who are falling behind before the deadline, not after it.
In an LMS, that’s a repeatable weekly process:
- Pull the progress report at the start of each week: Look at completion percentage per learner and, critically, their last active date, not just how far along they are.
- Separate “stalled” from “never started”: A learner at 40% who logged in yesterday needs a different nudge than someone who hasn’t opened the course since enrollment.
- Filter by team, not the whole organization: Save that filtered view so you’re not rebuilding it every week. Most LMS platforms let you save a segment by name.
- Check progress at the halfway point of the training window: That’s when a reminder still gives people time to catch up.
- Escalate only what needs escalating: Line managers should see their own team’s status. L&D typically needs an organization-wide view to spot patterns (eg one department consistently lagging).
This is the same underlying data as the completion and progress reports covered later in this guide. The difference is when you look at it. Progress tracking is what you do mid-program, whereas completion and compliance reports are what you pull once it’s over.
How to measure training effectiveness
Completion tells you that training happened and that the course has been ‘completed ‘. However, it doesn’t tell you whether it worked, and “did it work” is what leadership is actually asking when they ask if training is effective.
Key training metrics and KPIs to track
Beyond completion rate, the metrics worth tracking depend on what the training was for:
- Assessment scores and pass rates: did learners retain the material, not just click through it?
- Time-to-completion: are people finishing within the expected window, or dragging it out over months?
- Post-training performance change: the metric covered below, tied to a real business outcome.
- Manager-reported behavior change: a simple survey or checklist a manager fills out weeks after training, asking whether they’ve observed the trained behavior on the job.
💡For a deeper breakdown of which KPIs to track for which program type, explore our guide to training metrics and KPIs.
The Kirkpatrick model, made simpler
The most widely used framework for structuring training measurement is the Kirkpatrick Model, which breaks evaluation into four levels:
- Level 1 — Reaction: Did learners find the training relevant and engaging? (Post-training survey)
- Level 2 — Learning: Did they gain the intended knowledge or skill? (Assessment scores)
- Level 3 — Behavior: Are they applying it on the job? (Manager observation, checklists)
- Level 4 — Results: Did it move a business metric? (Performance data, before/after)
Most teams only measure Level 1 and 2 because that’s what an LMS gives you automatically. Levels 3 and 4 require deliberately connecting training data to something outside the LMS, which is exactly what the next section covers.
How to measure training ROI
The approach is straightforward even if the data-gathering takes some coordination.
Try this: for each training program, pick one business or performance metric you expect it to influence, and measure it before the program, then again at 30, 60, and 90 days after.
Here are some examples in real practice:
- Safety program: incident or near-miss rates before and after
- Onboarding: time-to-productivity for new hires
- Sales skills enablement: time-to-close or revenue per rep
- Product knowledge training: support ticket resolution time or CSAT scores
Your LMS gives you the learning and engagement side. Your HR system, CRM, or operational dashboards give you the business-impact side. Neither one alone answers whether it was effective, but together, they do.
LearnWorlds brings both sides into view: the completion and engagement data L&D needs day to day, and the reporting to show whether training moved the numbers leadership cares about.
Start a free trial to see it on your own training content.
LMS reports to track employee training
If you are using an LMS, each report below is organized around the question it actually answers, what to look for in the data, and what to do next because a number on a screen is only useful if it leads somewhere.
1. Completion report
“Has everyone who should have done this training actually done it?”
| Completion report | |
|---|---|
| What it shows | Who enrolled, who finished, who is in progress, who hasn’t started |
| Who uses it | L&D/Training manager, HR manager |
| Why use it | Tracking overall training coverage, compliance evidence |
Shows who enrolled, who finished, who’s in progress, and who hasn’t started yet. This report is used by L&D and HR managers to track overall coverage and produce compliance evidence.
A completion rate on its own is close to meaningless without the headcount behind it: 80% in a 10-person team means 2 people outstanding, and 80% across 200 people means 40. It’s also worth distinguishing learners who stalled partway through from those who never started. The first likely just needs a nudge, and the second may not know the training is required at all.
2. Progress report
“Who is on track and who is falling behind?”
| Progress report | |
|---|---|
| What it shows | Completion percentage per learner, last active date, sections visited |
| Who uses it | L&D/Training manager, Line Manager |
| Why use it | Identifying at-risk learners early, spotting team-level patterns |
Shows completion percentage per learner, last active date, and sections visited. It’s the report line managers use to catch at-risk learners early. The most useful signal is progress percentage combined with the last active date. A learner at 40% who was active yesterday is in a very different position from one at 40% who last logged in two weeks ago. The date is what tells you who actually needs attention.
Filter by team rather than viewing the whole organization at once. Most LMS platforms let you save that filtered view so you don’t have to rebuild it each time. Check this report at the halfway point of your training window so you have time to reach out to learners falling behind.
3. Assessment report
“Do learners actually understand the material, or did they just click through it?”
| Assessment report | |
|---|---|
| What it shows | Scores per learner, pass/fail rates, performance per question |
| Who uses it | L&D/Training manager |
| Why use it | Validating knowledge retention, identifying content gaps |
The assessment report shows how learners performed on quizzes and exams: scores per learner, pass and fail rates, attempts, and, on most platforms, how they answered each question. Use this report to review and improve your content, not to judge individual learners.
The overall pass rate is useful, but the question-level breakdown is where you find the most actionable information. If 60% of learners are failing the same question or assignment, the issue is likely in the content, not the learners. It could be a concept that wasn’t explained well or an ambiguous question.
4. Compliance training report
“Are we covered? And can we prove it?”
| Compliance training report | |
|---|---|
What it shows | Completion status and dates for mandatory courses, who is overdue |
| Who uses it | HR manager, L&D/Training manager |
| Why use it | Regulatory evidence, tracking mandatory training deadlines |
The compliance training report ensures you can prove to an external party that specific people completed specific, mandatory training before a specific deadline. It’s a record you produce and store, not a dashboard you check. The fields that matter are learner name, course name, and completion date.
If your compliance training requires recertification, track certificate issuance dates and set a reminder process to identify learners whose certificates are approaching expiry.
5. Engagement report
“Are learners actually consuming the content, or just opening it?”
| Engagement report | |
|---|---|
| What it shows | Video watch rates, time spent per module, drop-off points, last activity date |
| Who uses it | L&D/Training manager |
| Why use it | Content review and iteration, identifying where learners disengage |
Anyone can mark a course complete without really engaging with it. Engagement metrics show you where learners are actually spending time, where they slow down, and where they stop.
For example, if most people drop off at the same point in a course, that shows something isn’t working: the material is too dense, the format shifts, or the module runs too long for the context people are learning in. Use these metrics when you’re reviewing or updating content to prioritize accordingly.
The right report for the right person at a glance
The five reports above cover different questions and different audiences. When you need to decide quickly which one to pull, use this as your reference.
| Primary question | Report to use | Stakeholder | |
|---|---|---|---|
| Who is behind across the organization? On which programs? | Progress report + completion report | L&D/Training Manager | |
| Are my people on track? Who do I need to follow up with? | Completion report filtered by team | Line Manager | |
| Are we compliant? Can we prove it? | Completion report with dates, exported and stored externally | HR Manager | |
| Is training happening and is it working? | Completion rate + assessment scores + engagement summary | Department Head/HR Manager | |
| Is the content working or does it need revision? | Assessment report + engagement report | L&D/Training Manager | |
A note on automated delivery:
Most LMS platforms, including LearnWorlds, let you schedule certain reports to be sent automatically to specified recipients on a regular cadence. Instead of pulling and sending data manually, you set it up once, and it runs in the background.
💡Learn more about scheduled reports in LearnWorlds.
How to measure training effectiveness using LMS vs business data
When leadership asks if training is effective, they don’t mean whether people finished it or how much they scored on the final exam. They want to know whether it had an impact on the business.
The approach is simple: for each training program, identify one business or performance metric you expect it to influence. Measure it before the program and again at 30, 60, and 90 days after completion.
Some examples of what this looks like in practice:
- Safety program: incident or error rates before and after
- Employee onboarding: time-to-productivity for new employees
- Sales skills enablement: time-to-close or revenue per rep before and after
- Product knowledge: ticket resolution times, CSAT scores, or sales (depending on the team)
LMS analytics give you the learning and engagement data that HR and L&D departments care about. Your HR system, CRM, or operational dashboards demonstrate the business impact leadership cares about. Put them side by side, and you have the complete picture.
💡Read also: Show me the money: How to prove training ROI to clients & CFOs.
Common mistakes in training reporting and how to avoid them
Even with the right report in place, a few common oversights tend to undermine the data. These are the ones worth watching for.
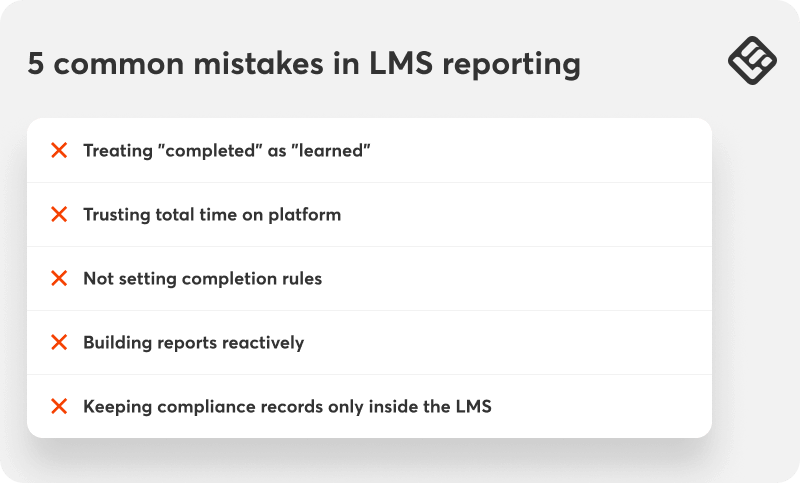
Treating “completed” as “learned”
Completion is one of the easiest training and development metrics to track, which makes it tempting to treat it as the primary measure of success. But finishing a course and learning from it are not the same thing. If you want to have a better understanding of how much employees have retained, check assessment scores and pass rates as well.
Trusting total time on the platform
This figure includes time spent with a browser tab open but idle. It overstates active learning and will make your training programs look more engaging than they are. For more accurate measurement, check time spent inside the course player or at the module level, too.
Not setting completion rules
If you don’t set completion rules (no minimum watch time on videos, no passing score on quizzes), a 95% completion rate just means 95% of learners opened the course. It tells you who clicked through, not who learned anything.
And while that may not matter much for low-stakes training, like soft skills, it matters a great deal for safety, compliance, or any program where incomplete learning carries real risk.
Building reports reactively
At the start of each program, set up and save the filtered views you’ll need by team, course, completion status, or whatever is most relevant to stakeholders. That way, you can retrieve your report in one click.
Keeping compliance records only inside the LMS
Completion records inside the LMS are tied to the course being active and the account remaining in good standing. If a course gets archived or a plan changes, those records may become difficult or impossible to access. To avoid losing valuable compliance proof, export completion data with dates and store it somewhere independent of the platform.
How to track specific training types
Some training carries higher stakes if tracking fails. For example, a missed safety certification or unverifiable compliance records hides a risk exposure that can’t go unnoticed.
These categories deserve their own process, so let’s check them out.
How to track compliance training
Compliance tracking exists to answer one question when it matters most: can you prove a specific person completed specific, mandatory training before a specific deadline?
Beyond the completion report basics above, keep an export of completion records (name, course, date) stored somewhere independent of your LMS, since course or plan changes can make in-platform records harder to retrieve later.
For requirement specifics by industry, SHRM’s compliance training resources are a reliable reference point.
How to track safety training
Safety training tracking has the same requirements as compliance tracking, with one addition: because the cost of an incomplete record is a workplace injury rather than just a failed audit, many teams add a secondary check.
A supervisor sign-off or observation checklist, alongside the LMS completion record, can be useful, especially for hands-on or equipment-related training.
How to track contractor employee training
Contractors and non-employee workers often aren’t in the same HR system as full-time staff, which is what makes tracking their training completion harder.
Most LMS platforms solve this with a custom user role or guest access group scoped to only the training contractors need, which still produces the same completion and compliance reports as regular learners; you’re just filtering by that group. This keeps contractor records auditable without giving them access to internal-only content.
How to track certifications and renewals
Certification tracking is a compliance report with an expiry date attached. The setup that works best: record the certificate issuance date at completion, calculate the renewal date from your organization’s recertification interval, and set an automated reminder (to the learner, their manager, or both).
A defined window before it lapses (30 or 60 days is typical). This turns certification tracking from something someone has to remember into something the system surfaces on its own.
Start with the question, not the report
Tracking employee training is an entire system: a method that fits your scale, a way of catching learners who fall behind while training is still running, a way to tell whether the training actually changed anything, and records you can produce the day someone asks for proof.
Now, you no longer need to guess how to track training employees. The five report types in this guide will cover most of what you need day-to-day, and the effectiveness and compliance sections address the aspects that a completion percentage alone can’t capture.
LearnWorlds for employee training helps you onboard, train, and upskill your people while giving you the reporting tools you need to track and prove it’s working. Try it with a 30-day free trial.
FAQs
Pick one business or performance metric each program should influence, then measure it before training and again at 30, 60, and 90 days after. Pair your LMS data (completion, assessment scores, engagement) with outside data like HR systems, CRM, or operational dashboards to see if it actually moved the needle.
The Kirkpatrick Model is a useful framework here. Most teams only measure Reaction and Learning, but Behavior and Results are where real effectiveness shows up.
Dedicated training tracker tools sit between a spreadsheet and a full LMS, handling scheduling, completion tracking, and certification expiry reminders without course-authoring or delivery features.
They make sense if your training content lives elsewhere (in-person sessions, external certifications) and you mainly need to track that it happened, not host it.
Yes, smaller teams often start with manual tracking via spreadsheets or by logging completions as an employee attribute in an existing HRIS.
Both work at a small scale but break down as headcount or course volume grows, since there are no automatic reminders, in-progress visibility, or granular data like quiz scores and drop-off points.
Most LMS platforms support a custom user role or guest access group scoped to just the training contractors need.
This produces the same completion and compliance reports as regular learners (you’re simply filtering by that group), keeping records auditable without giving contractors access to internal-only content.
Beyond course completion rate, prioritize assessment scores and pass rates, time-to-completion, post-training performance change, and manager-reported behavior change.
Which metrics matter most depends on the training’s purpose. A compliance course and a sales enablement program, for example, aren’t measured the same way.
Leadership generally cares less about raw completion numbers and more about whether training moved a business metric. Combine your completion rate with assessment scores and an engagement summary, and, where possible, tie it to before/after performance data (eg time-to-productivity, incident rates, or revenue per rep) to show real impact.
You can use a shared spreadsheet with columns for employee name, course, start date, completion date, and score. It works fine for a handful of people and courses, but requires manual updates for every completion and offers no automatic reminders.
For compliance, keep an export of completion records (name, course, date) stored independently of your LMS, since archived courses or plan changes can make in-platform records hard to retrieve later.
Safety training carries the same requirements, plus many teams add a supervisor sign-off or observation checklist as a secondary check, especially for hands-on or equipment-related training.

Kyriaki is the Organic Content Strategist at LearnWorlds, where she writes and edits content about marketing and e-learning, helping course creators build, market, and sell successful online courses. With a degree in Career Guidance and a solid background in education management and career development, she combines strategic insight with a passion for lifelong learning. Outside of work, she enjoys expressing her creativity through music.

Androniki Koumadoraki
Androniki is a Content Writer at LearnWorlds sharing Instructional Design and marketing tips. With solid experience in B2B writing and technical translation, she is passionate about learning and spreading knowledge. She is also an aspiring yogi, a book nerd, and a talented transponster.
Related Articles