

Table of Contents
Key takeaways
- Completion rates and satisfaction scores don’t correlate with business performance. They answer “did people show up,” not “did it work.”
- CFOs and executives think in three lenses (operational, financial, strategic) and expect proof in those terms, not training jargon.
- ROI isn’t calculated once at the end. It’s built across four pillars, starting before training even begins.
Nobody has ever thrown a party for a 95% completion rate. Not a CFO, not a client, not a boss deciding whether to renew your contract next year.
That’s the uncomfortable truth Kim Merritt, President and Founder of The URL Dr, opened with at LearnWorlds’ World of Learning session on training ROI. The global corporate training market is valued at $360 billion, yet 75% of training budgets lack ROI measurement, according to Merritt. CFOs demand proof, clients question value, and internal teams need justification just to keep programs funded.
That gap is where training providers either become the strategic partner a client can’t live without, or stay a line item that gets cut when budgets tighten.
This guide is for B2B training providers, course authors selling into corporate buyers, and internal L&D teams who need to prove the business value of their programs to the executives and clients who fund them. If you’ve ever lost a renewal or a budget approval because you couldn’t show measurable impact, keep reading.
The problem: Training programs fail to prove business value
This is where most course sellers and L&D teams get stuck, and it shows up as a handful of recurring pain points:
- Difficulty proving the financial value of training to decision-makers
- Relying on vanity metrics that don’t impress clients or CFOs
- Losing deals or budget approvals because there’s no measurable ROI to point to
- Struggling to connect learning results to business outcomes like revenue or retention
Merritt calls the root cause the vanity metrics trap. Most L&D teams still report on the same five things: completion rates, satisfaction scores, knowledge retention, hours of training delivered, and number of employees trained. As she put it:
“These metrics don’t have a correlation with business performance. They answer, did people show up? But not did magic happen?”
Kim Merritt, President and Founder of The URL Dr
Executive leadership, she said, often treats these numbers as the business equivalent of participation trophies. A program can hit 98% completion and satisfaction scores through the roof, and still have zero impact on the bottom line.
The disconnect: What L&D measures vs. what executives value
According to Merritt, the gap isn’t a data problem. It’s a language problem.
- What L&D reports: Learning objectives achieved, engagement metrics, knowledge transfer success
- What executives actually track: Revenue growth, market share, customer satisfaction and retention, operational efficiency and cost reduction, risk mitigation and compliance, competitive advantage
Closing that gap starts with a mindset shift Merritt calls the business case framework. The framework reframes training from a cost to minimize into an investment with expected returns.
- Old school mindset: Training is an expense. You minimize cost per participant, justify spend with compliance requirements, and measure success by budget adherence.
- New school mindset: Training is an investment. You measure success by business impact, drive spend by business opportunity, and focus on value per dollar invested.
As Merritt summed it up:
“When clients work with you, they’re not buying training, they’re investing in measurable business performance improvements.”
Kim Merritt, President and Founder of The URL Dr
Once that reframe lands, the next question is which ROI story matters to which audience. Merritt breaks it into three perspectives:
- Operational ROI (for operations leaders): Efficiency gains, process improvements, quality improvements, error reduction, time savings
- Financial ROI (for decision-makers): Revenue increases, cost avoidance, productivity gains
- Strategic ROI (for executives): Market positioning, employee retention, customer loyalty, brand reputation
Same training program, three different stories, depending on who’s in the room.
💡Read also: Employee training and development: A step-by-step guide to doing it right.
The solution: The four pillars of measurable ROI
Merritt shared the four pillars she recommends for proving training ROI to clients and CFOs.
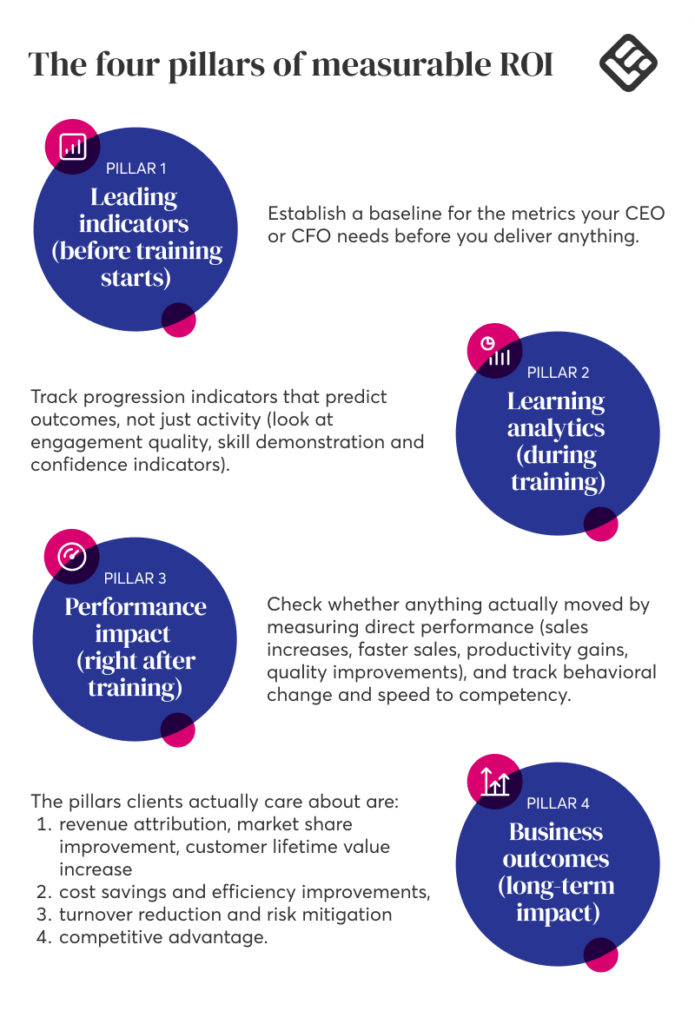
Pillar 1: Leading indicators (before training starts)
Establish a baseline before you deliver anything:
- Pick baseline metrics the CEO or CFO actually cares about. As Merritt puts it, “it doesn’t matter to the person who’s signing the checks,” is a metric to drop
- Run a capability audit: What can people do today vs. what they should be able to do
- Assign a dollar cost to underperformance
- Document the cost of doing nothing, such as lost sales, customer churn, and efficiency losses
- Set baselines 90 days before training begins
There’s a reason why this is so important, according to Merritt:
“When you present the meaningful problems and build the narrative around the cost of not fixing things, suddenly your $25,000 or $50,000 or $100,000 training looks like a real bargain.”
Pillar 2: Learning analytics (during training)
Track progression indicators that predict outcomes, not just activity:
- Engagement quality: Time on task, completion quality, peer interaction, return engagement
- Skill demonstration: Practical application scores, simulation performance, and progressive skill building
- Confidence indicators: Self-assessment shifts, manager observations, peer feedback
Merritt makes the case that confidence matters just as much as competence:
“Confidence is the bridge between learning and performance. Someone can know how to do something, but if they don’t feel confident doing it, your ROI just went out the window.”
Pillar 3: Performance impact (right after training)
This is where you check whether anything actually moved:
- Direct performance measurement: Sales increases, bigger or faster deals, productivity gains, quality improvements
- Behavioral change tracking: What supervisors and customers are actually noticing
- Speed to competency: How fast new performance reaches a productive baseline
Interestingly, Merritt shared a proof point from a real client result. Merritt said that Peter Gallagher, a learning and development lead at Denny’s, reported that customer service scores jumped 30 points after a training program, moving the restaurant chain from the middle of the pack to an industry leader in customer service.
And for anyone who assumes ROI requires a massive program, this result came from a 10-minute mobile-optimized micro-course, not a multi-module curriculum.
Pillar 4: Business outcomes (long-term impact)
When we drill down, these are the pillar clients actually care about:
- Revenue attribution, market share improvement, and customer lifetime value increases
- Cost savings from fewer errors, efficiency improvements
- Turnover reduction, risk mitigation (avoided compliance issues, accidents, lawsuits)
- Competitive advantage—industry rankings, awards, retention rates, employee engagement
How to present ROI stories that resonate with clients and CFOs
Having the data is half the job. Presenting it so a busy CFO absorbs it in seconds is the other half. Merritt’s rule of thumb for any chart or graphic is the 30-second rule:
“If it takes longer than 30 seconds to understand your chart, it’s not a chart, it’s a puzzle. And executives don’t have time for puzzles.”
Kim Merritt, President and Founder of The URL Dr
This is where executive storytelling comes in: show transformation, not numbers, and translate training metrics into business language. Here are a few examples of how that looks in practice:
- Instead of “knowledge retention improved 23%” → “Employees now solve problems 23% faster, reducing customer wait times.”
- Instead of “course completion rate was 94%” → “94% of your team is now equipped to drive the performance improvements we’re tracking.”
Tailor the message to the audience in the room:
- CFOs: Lead with ROI percentages, cost savings, risk mitigation
- Operations leaders: Focus on efficiency gains, quality improvement, and process optimization
- HR leaders: Emphasize employee satisfaction, retention, and capability building
Finally, structure your story in the right way. Merritt recommends these three story structures:
- The narrative arc: Challenge, solution, victory, future impact
- Quantitative + qualitative: Numbers for credibility, testimonials for memorability
- The risk mitigation story: What violations, accidents, or losses were avoided
Quick rollout plan: Implement ROI tracking in 30-60-90 days
For anyone starting from zero, the session closed with a practical rollout plan you can steal:
- Days 1-30: Audit current measurement practices, identify two to three key business metrics per program, establish baseline measurement protocols
- Days 31-60: Implement tracking systems and analytics, begin data collection on active programs, build ROI reporting templates
- Days 61-90: Compile first ROI reports, present findings to stakeholders, refine the process
Merritt’s closing advice sums up the whole approach: “Start measuring now. Perfect it later.”
💡Read also: How to track employee training: A practical guide.
Turn this into your ROI system, not a one-off report
ROI measurement is what turns a training provider into a strategic partner a client can’t afford to lose. The four pillars we cover in this guide give you the structure. The storytelling rules make sure the proof actually lands.
If you’re already running programs but have no baseline data to show for them, start with pillar one: pick two or three metrics your decision-maker actually cares about, and start tracking them before your next program launches.
See how LearnWorlds’ analytics and reporting tools support these pillars automatically, from baseline data to completion, performance, and business outcome reporting, so you’re not building this from scratch in a spreadsheet.

Kyriaki is the Organic Content Strategist at LearnWorlds, where she writes and edits content about marketing and e-learning, helping course creators build, market, and sell successful online courses. With a degree in Career Guidance and a solid background in education management and career development, she combines strategic insight with a passion for lifelong learning. Outside of work, she enjoys expressing her creativity through music.
 Back to blog
 Scroll to top
Related Articles